Youngsang's Portfolio

I am a civil servant for the Republic of Korea government, where I work for the Ministry of National Defense. I am also a Non-resident Fellow at the New Lines Institute for Strategy and Policy in Washington D.C. I hold a Master of Urban Spatial Analytics degree from the University of Pennsylvania. My research focuses on applying and integrating geospatial information in the defense sector. I am also interested in street address systems, geocoding, and wayfinding that utilize mobile maps.
Geospatial Analytics in Public Policy
Geospatial analytics plays a critical role in the field of public policy. Here are some examples demonstrating the use of geospatial information in public policy with R and open data.
Crashes and the City: How Built Environments Shape Robotaxi Crashes in San Francisco
May 5, 2025
Worked with Wang, Shuai and Jiang, Emmanuel
Instructor: Prof. Li, Xiaojiang
Project advisors: Prof. Lin, Zhongjie; Tang, Ziyi; Yi, Shengao
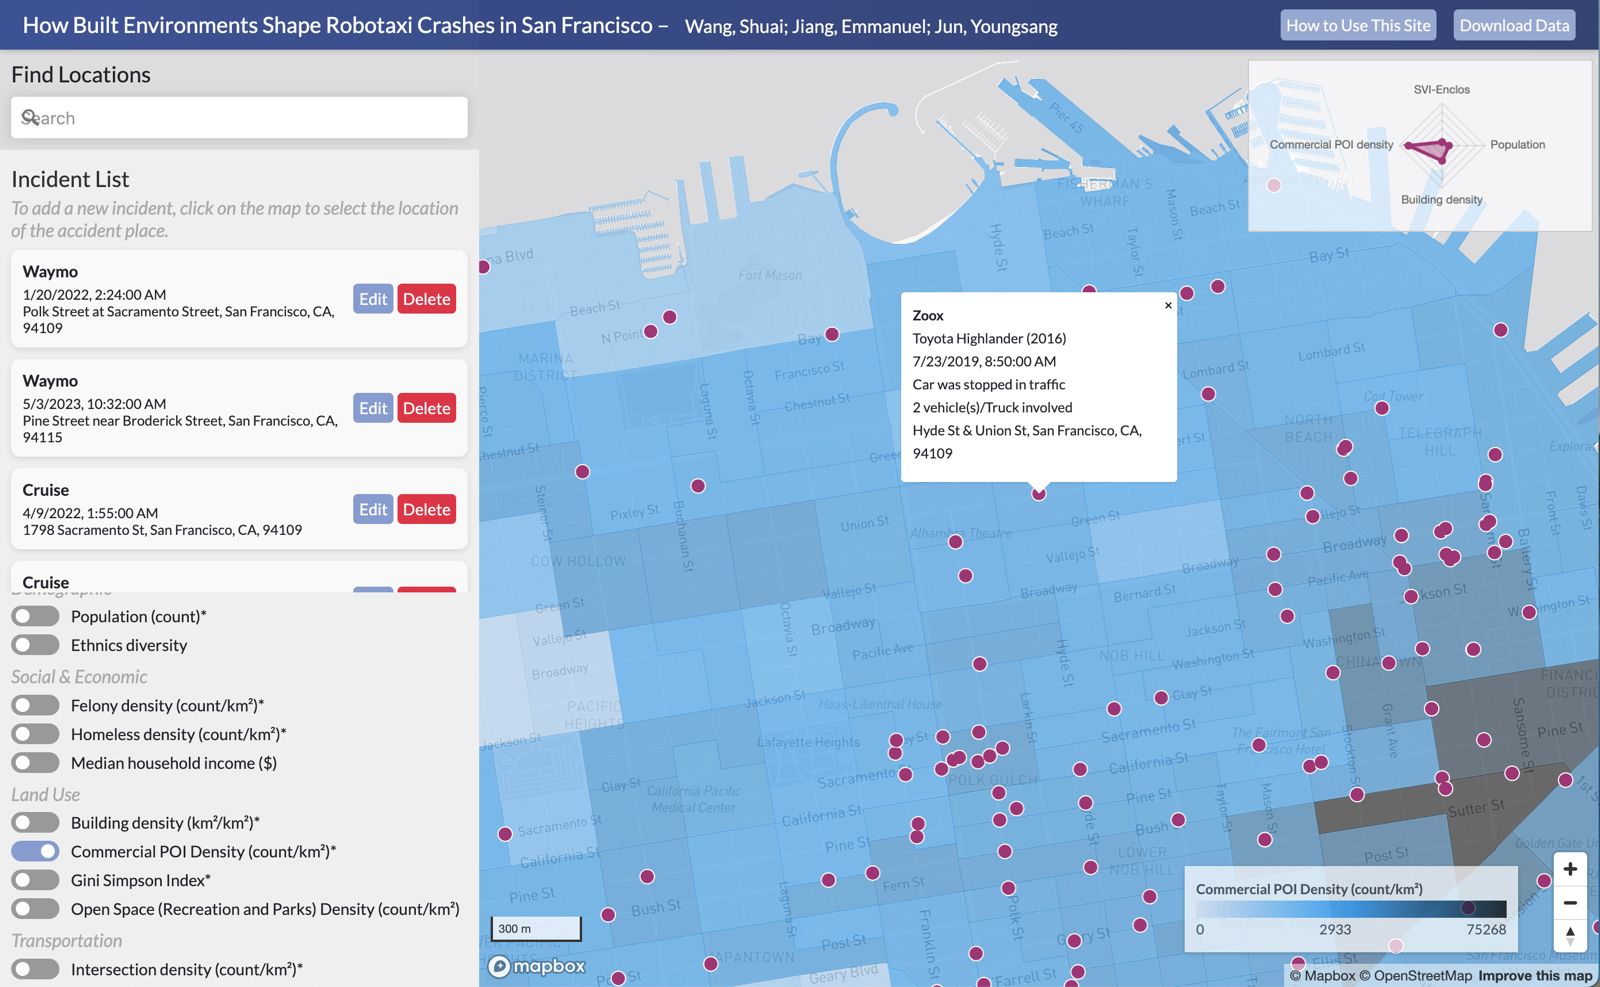
Robotaxi adoption is no longer hypothetical. This study provides visualization and modeling that shows how built environments shape robotaxi crash risks in San Francisco, allowing planners and policymakers to implement a “Try-Before-You-Build” approach.
Click here to see the live version of the dashboard and here to see the final presentation slide deck.
Do Households Value Transit-rich Neighborhoods compared to Others in Boston?
September 19, 2024
Instructor: Prof. Fichman, Michael
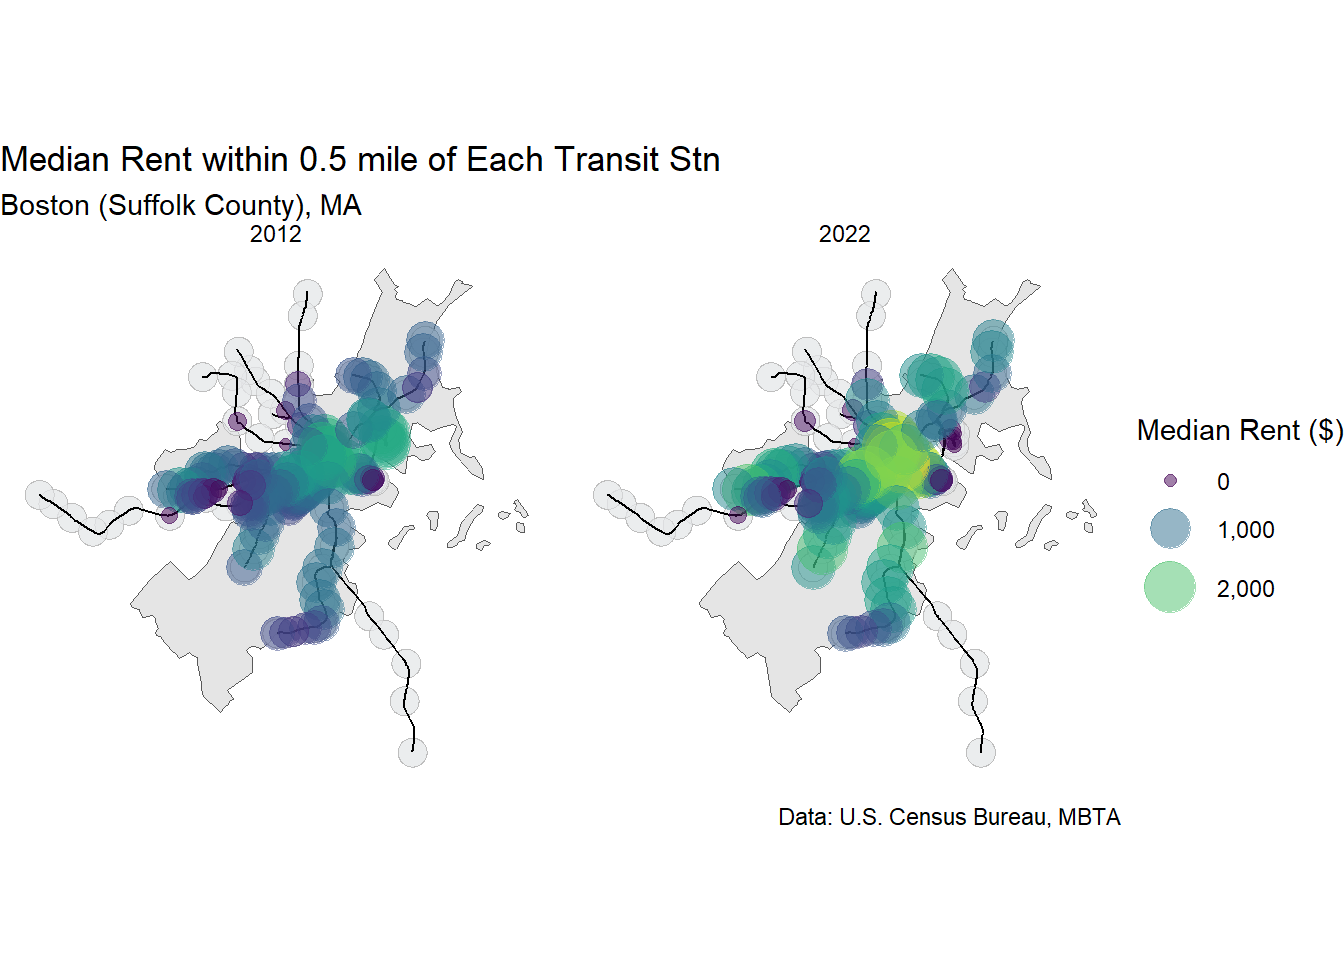
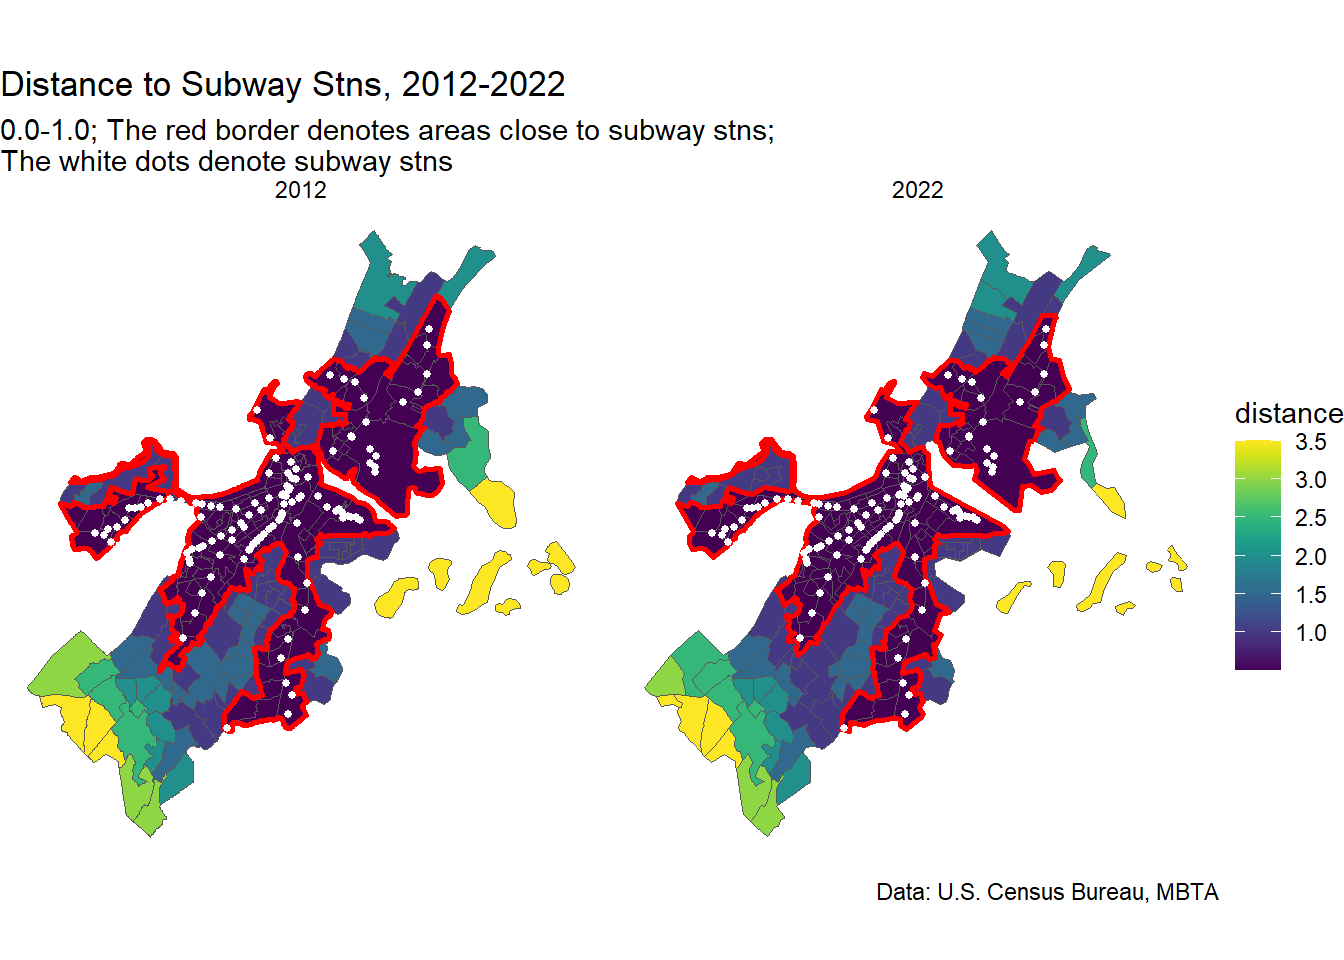
To solve the question on the subject, a Transit Oriented Development (TOD) analysis of Boston was conducted by using subway stations data from the Massachusetts Bay Transportation Authority (MBTA), along with American Community Survey (ACS) data of 2012 and 2022. The result shows that people are willing to pay higher prices to live near a transit station in 2022 compared to 2012. This example is drawn from Steif (2021), Public Policy Analytics.
Click here to see the full technical memo.
Geospatial Risk Prediction based on Broken Windows Theory
November 12, 2024
Instructor: Prof. Fichman, Michael
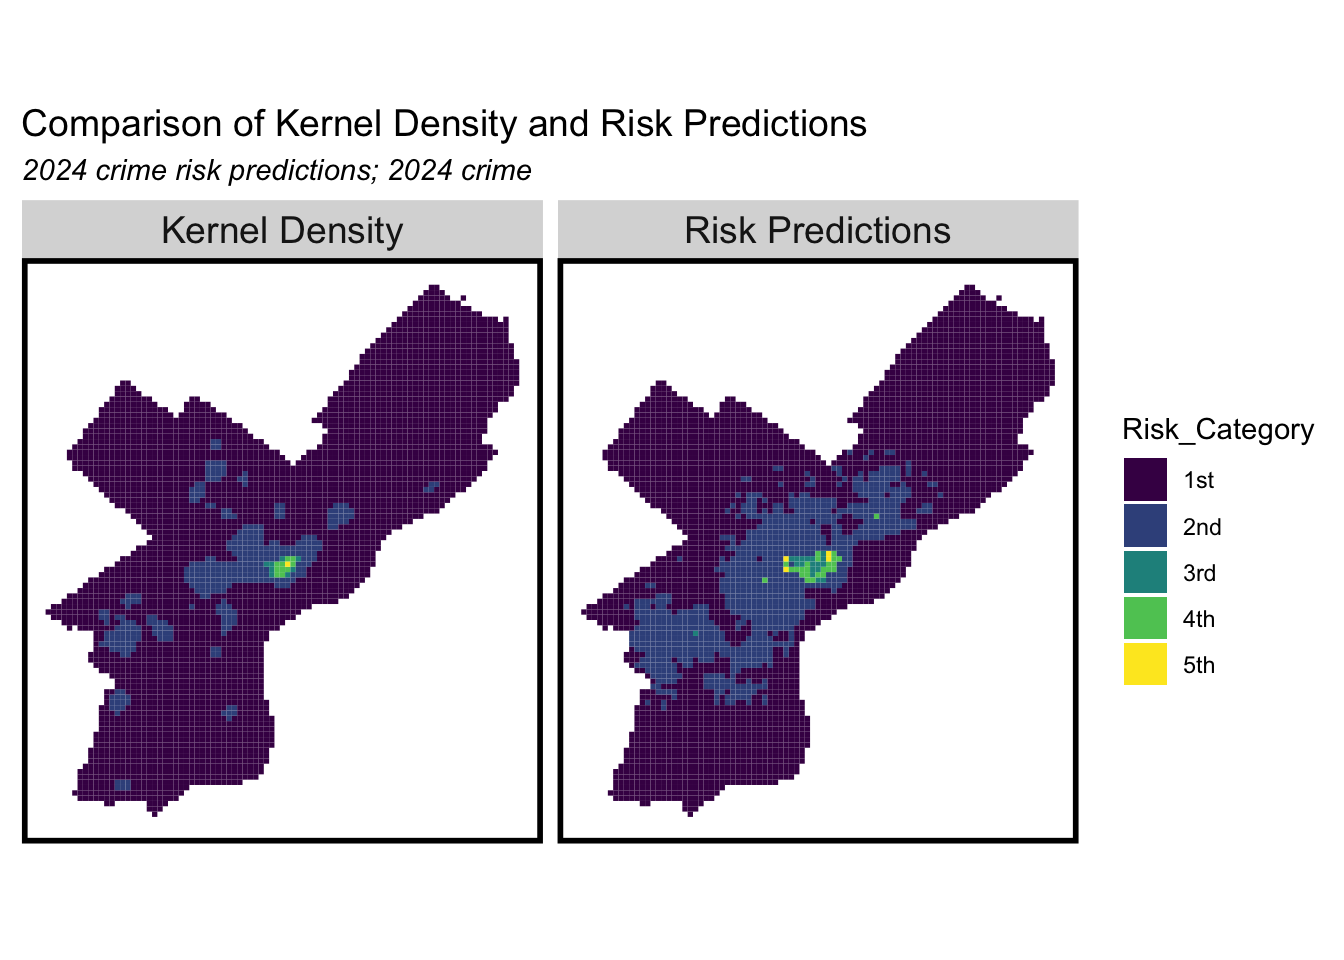
We can use geospatial analysis for prediction as well. This memo applies aspects of the Broken Windows Theory to visualize drug law violations incidents and produce predictive models to forecast similar crimes in other areas of Philadelphia. This example is drawn from Steif (2021), Public Policy Analytics.
Click here to see the full technical memo.
Who Should Receive a Housing Subsidy?
November 1, 2024
Instructor: Prof. Fichman, Michael
Emil City has conducted marketing campaigns targeting homeowners who qualify for a home repair tax credit program. However, due to a low conversion rate and random outreach to eligible homeowners, a more proactive approach is required. To improve the efficiency of the program, research was conducted to convert all the client-level data from previous campaigns into an improved model that can better target their limited outreach resources. This memo presents the results of the trained classifier and a cost-benefit analysis by using the results of the classification, by logistic regression of given datasets. This example is drawn from Steif (2021), Public Policy Analytics.
Click here to see the full technical memo.
Is the ex-offender job training program really helpful in reducing recidivism?
November 15, 2024
Instructor: Prof. Fichman, Michael
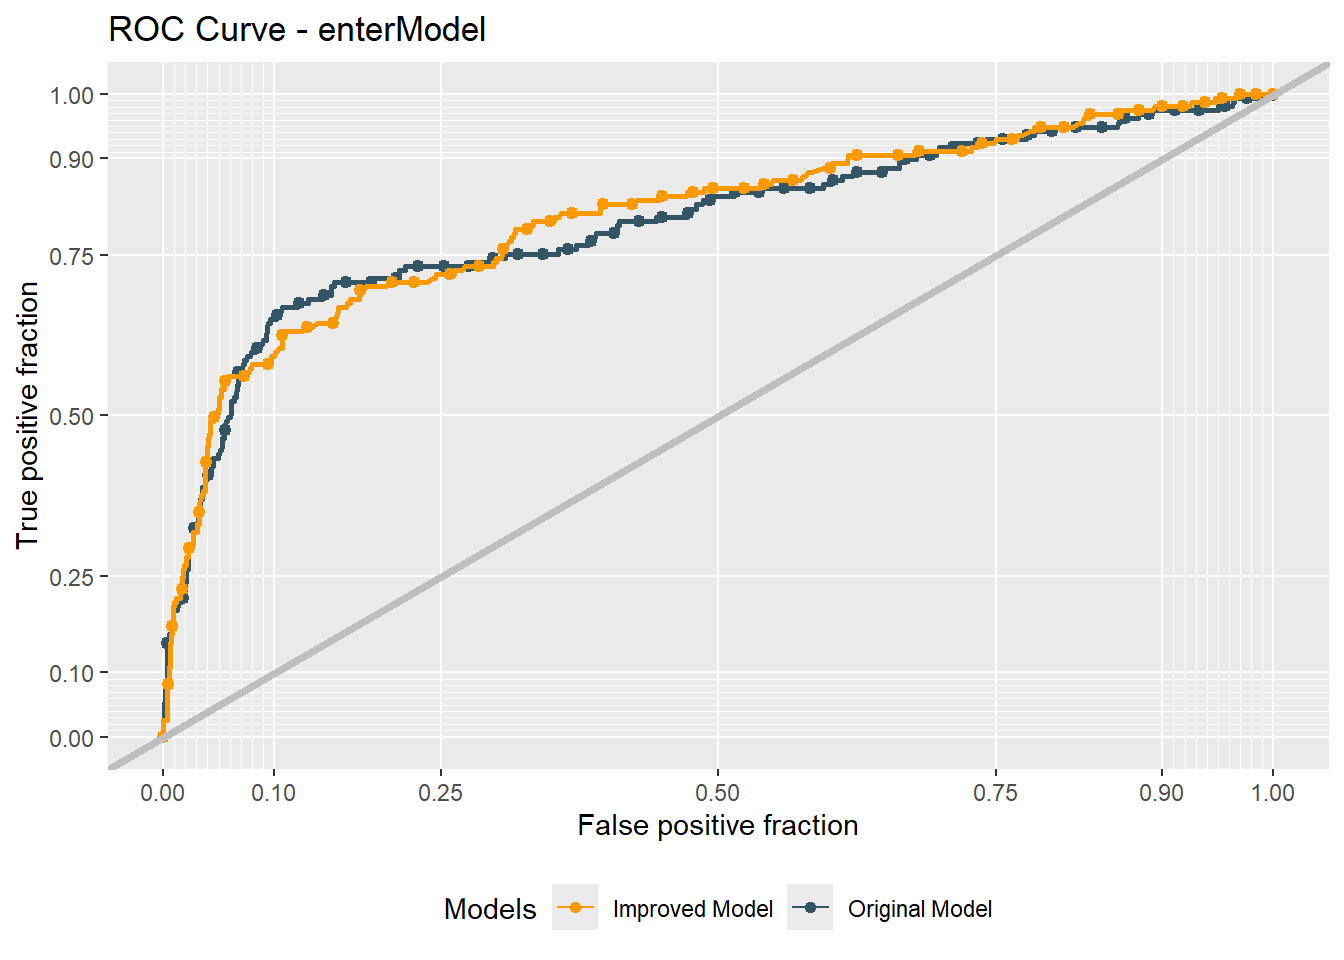
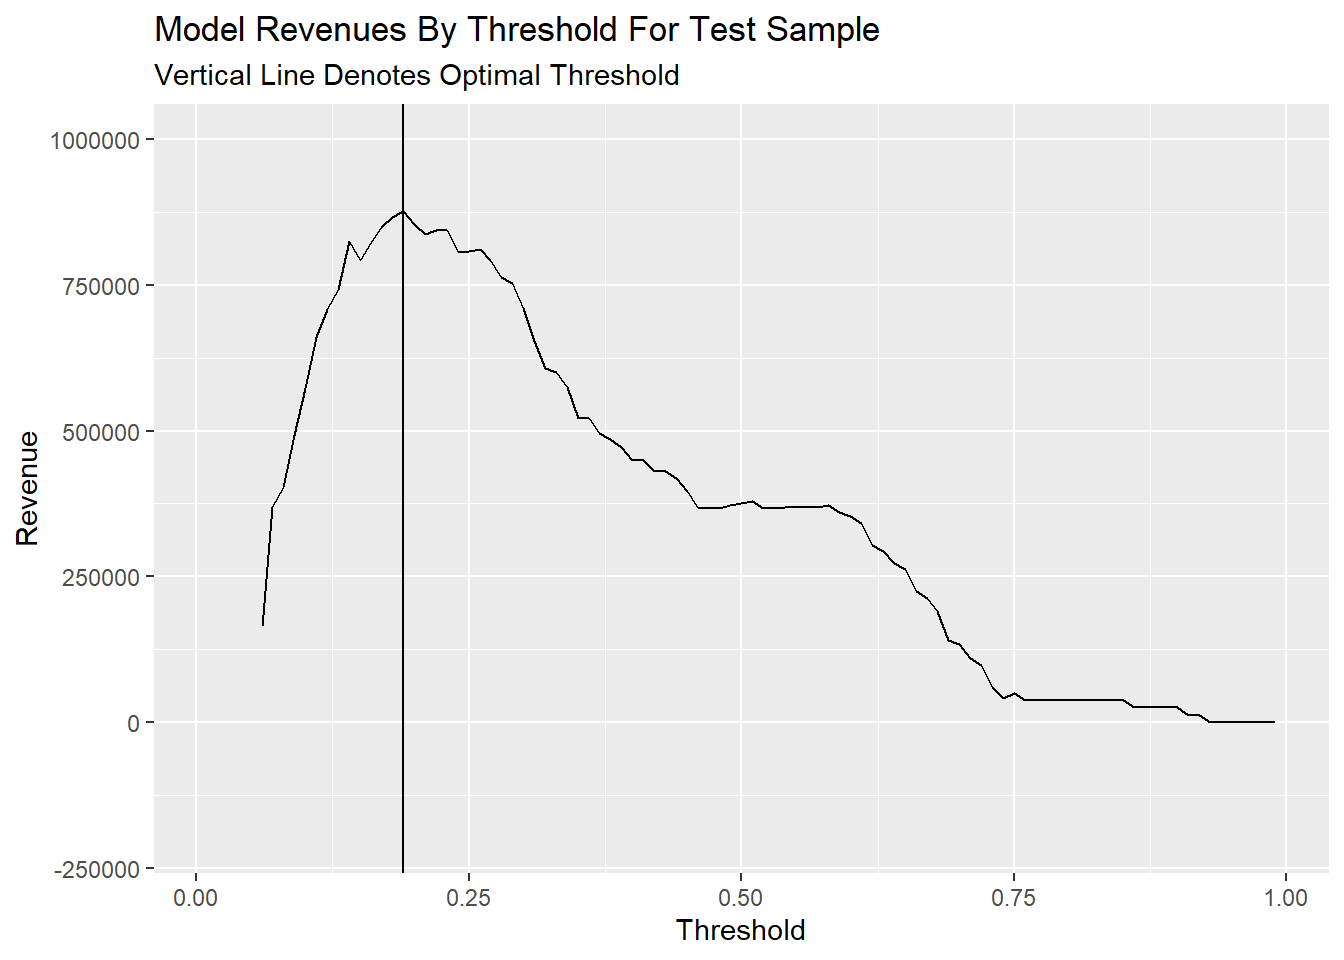
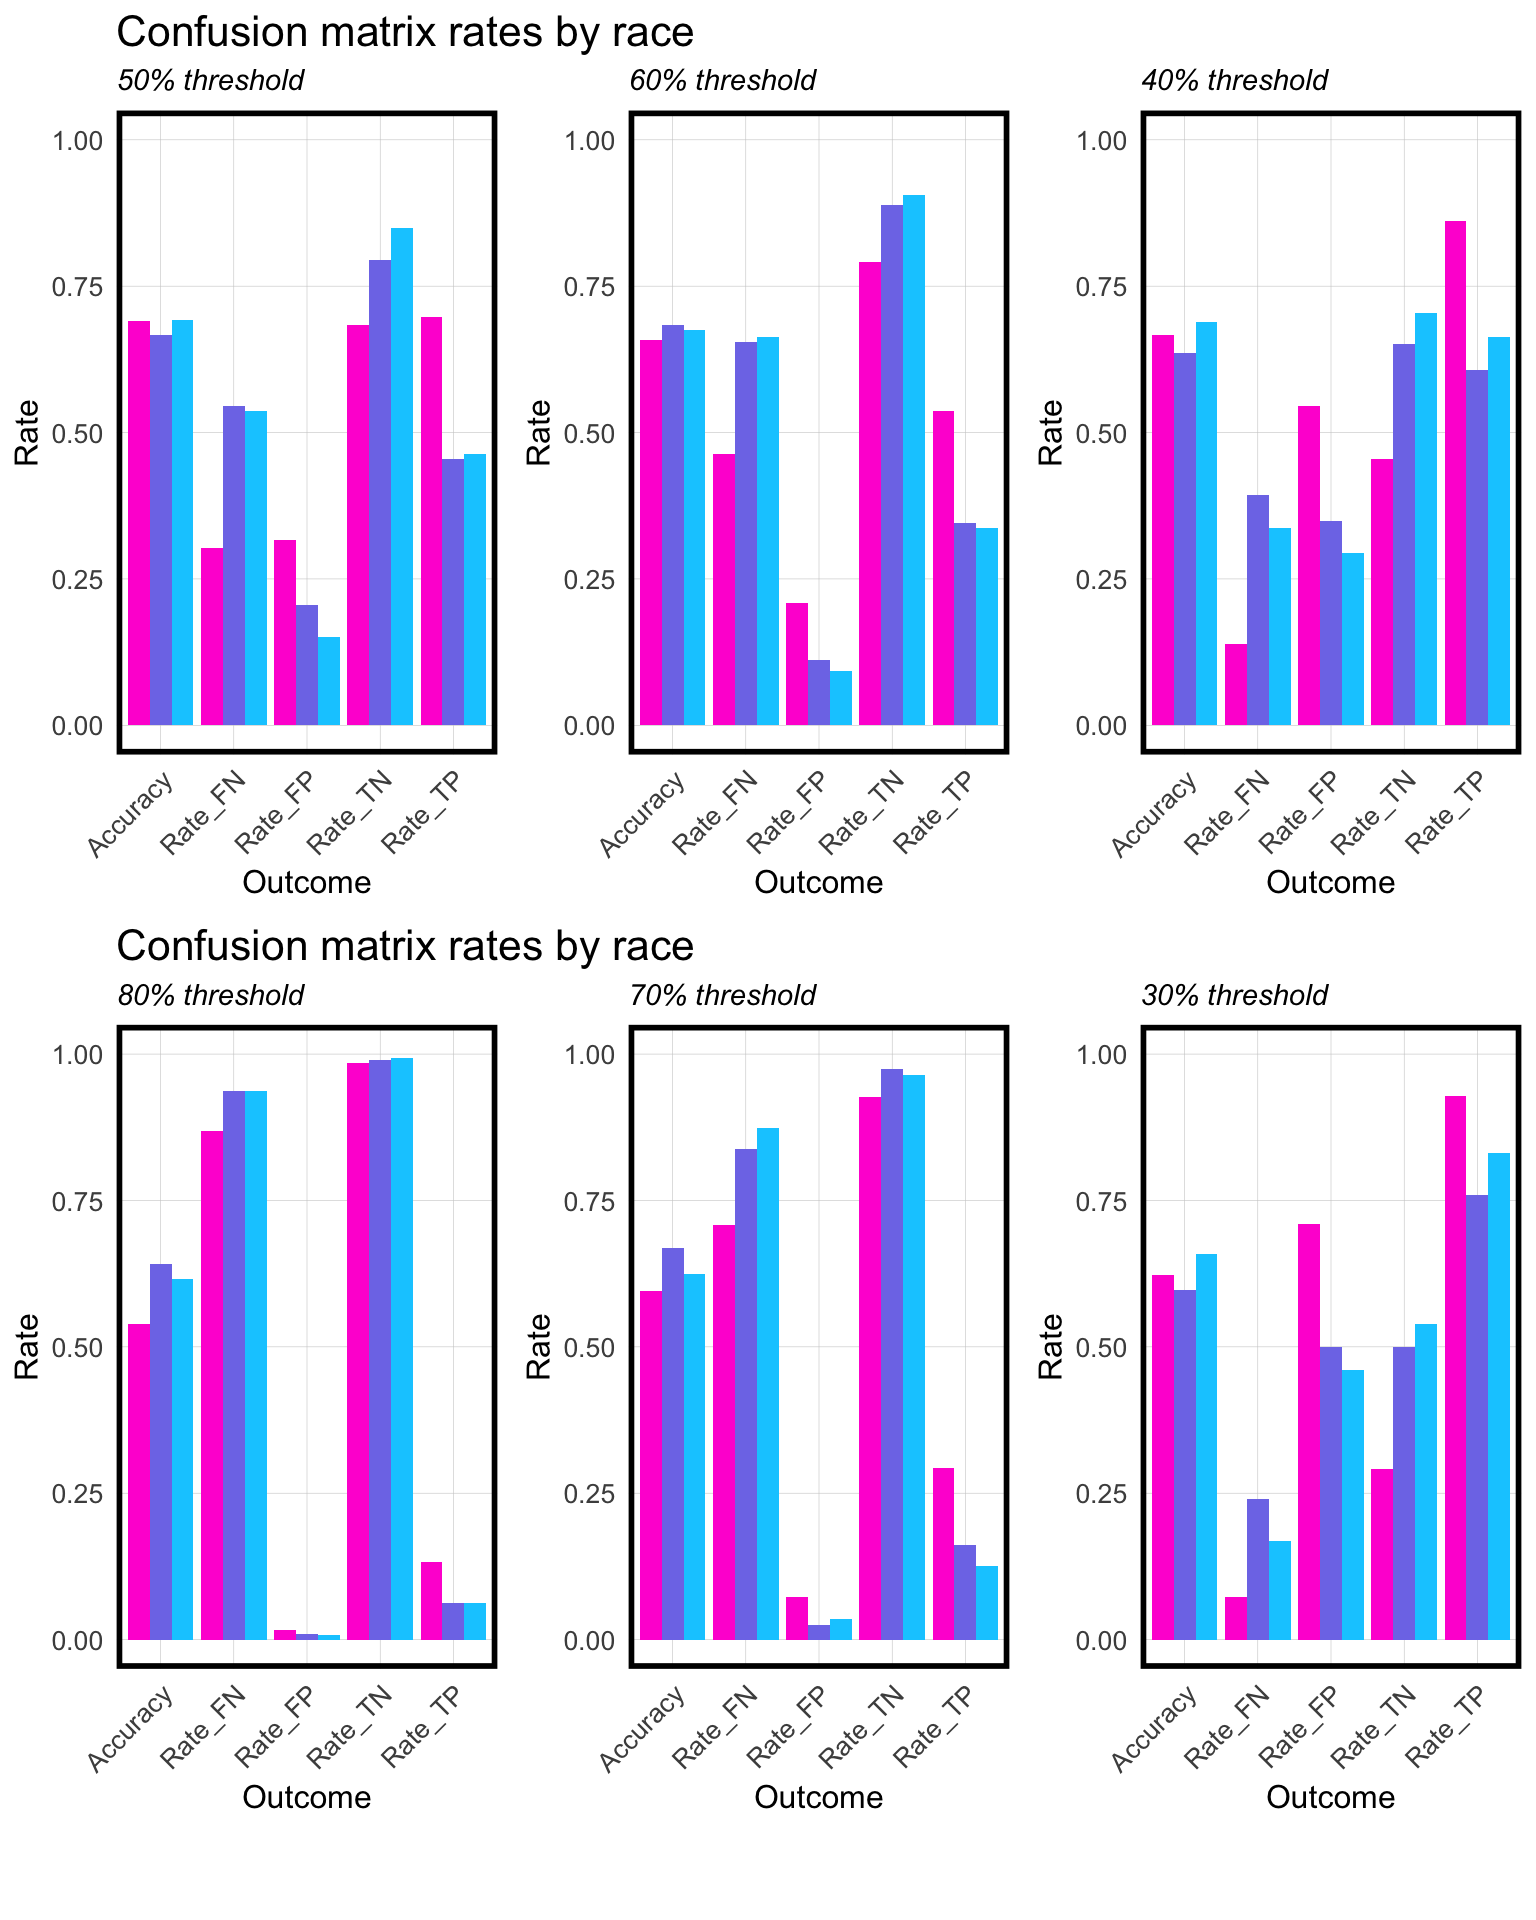
“A rehabilitated prisoner is not one who learns to survive well in prison but one who succeeds in the world outside prison on release.” Emil City has operated an ex-offender job training program based on this principle. However, let’s assume that recent austerity measures have limited the budget, and some officials have raised concerns about expanding the City’s limited job training resources on ex-offenders who recidivate shortly after their release is not good policy. There have also been ongoing concerns about the fairness of predicting recidivism rates across races. To improve the program’s efficiency, a new recidivism risk prediction algorithm should be considered. This recommendation outlines an improvement plan based on logistic regression and a cost-benefit analysis of recidivism risk predictions using the data of 7,214 inmates over 2013–2014. This example is drawn from Steif (2021), Public Policy Analytics.
Click here to see the full technical memo.
Suggestion for Home Price Prediction Model in Philadelphia
November 12, 2024
Worked with Agarwal, Vrinda
Instructor: Prof. Fichman, Michael
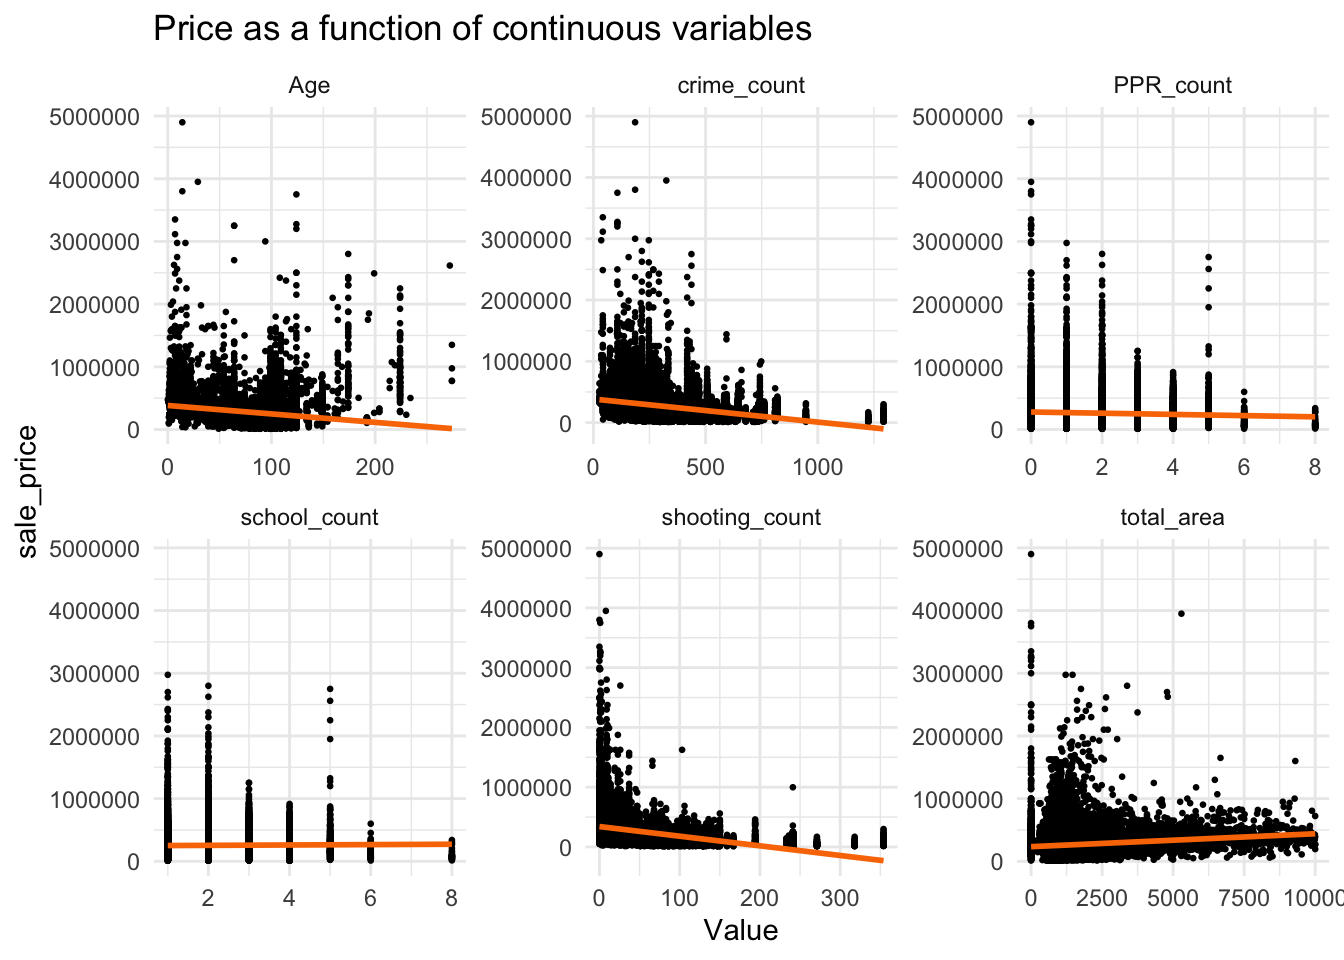
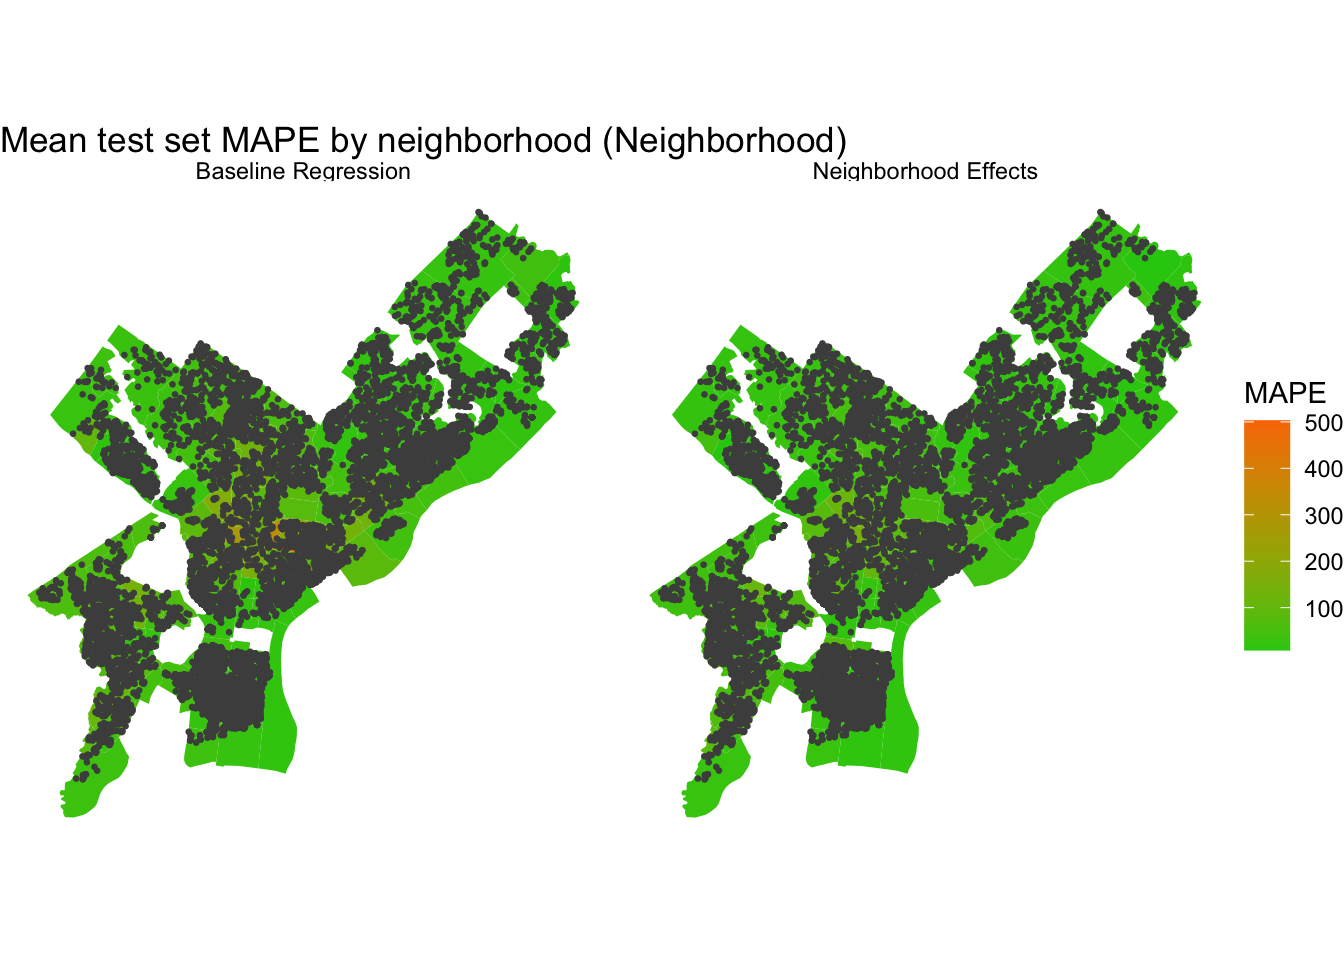
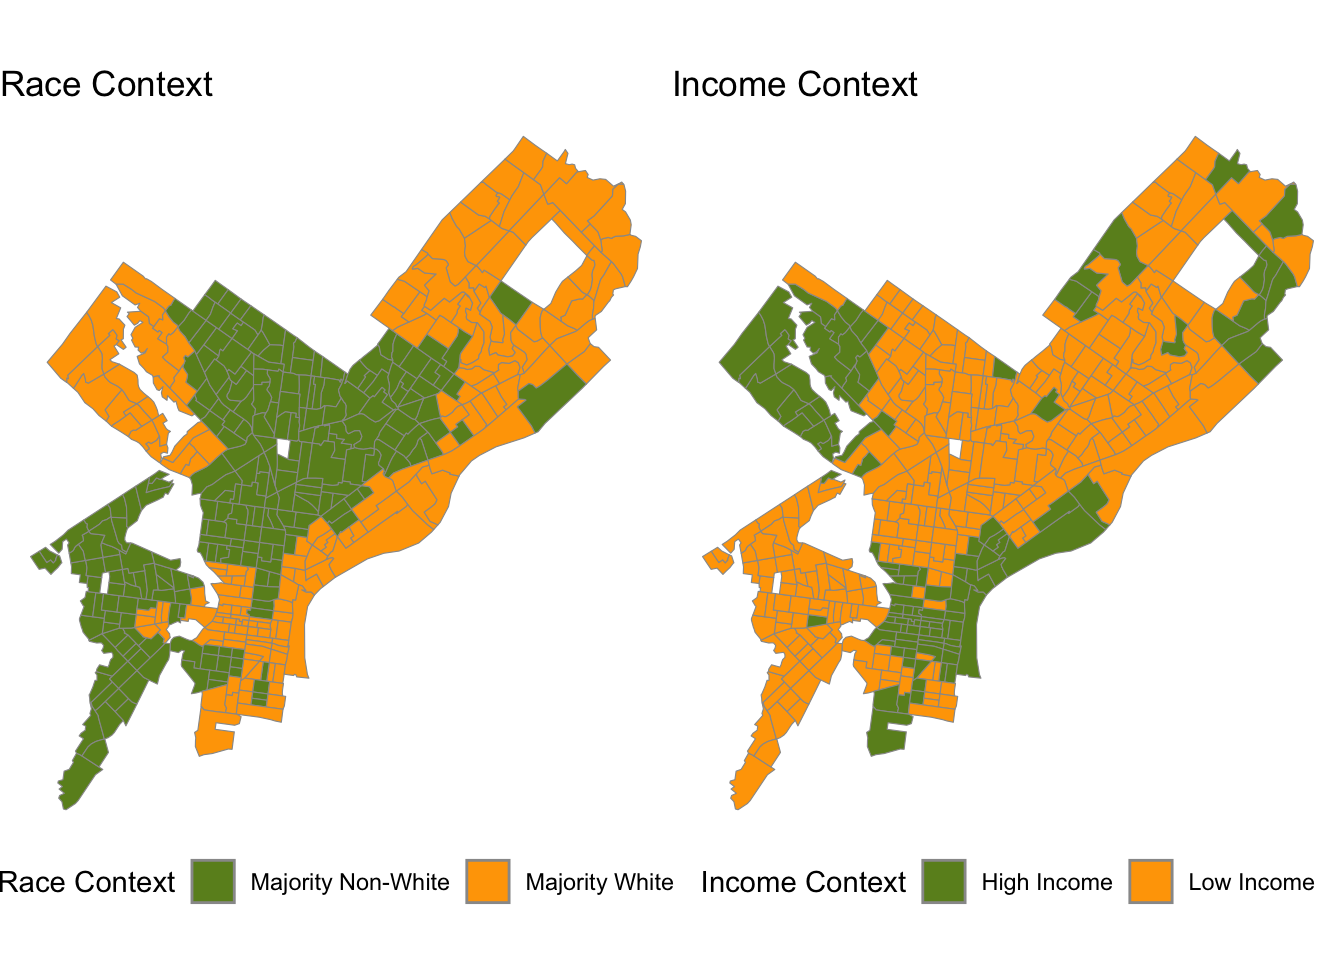
Let’s assume Zillow has struggled to accurately estimate home prices, partly because it is a national platform that often lacks detailed, localized information. Urban dynamics have become increasingly complex, and understanding housing markets requires a more granular approach that incorporates local factors like government policies, crime, gentrification, pollution levels, and access to public transit. Our objective is to use local data to create a model that predicts Philadelphia home prices with greater accuracy. By incorporating data on crime, zoning, pollution, and transit-oriented development, we aim to build a more contextually rich model that reflects the true dynamics of the city. This example is drawn from Steif (2021), Public Policy Analytics.
Click here to see the technical memo.
Forecast Train Occupancy Levels in Belgium
December 13, 2024
Worked with Indriaty, Tutut
Instructor: Prof. Fichman, Michael
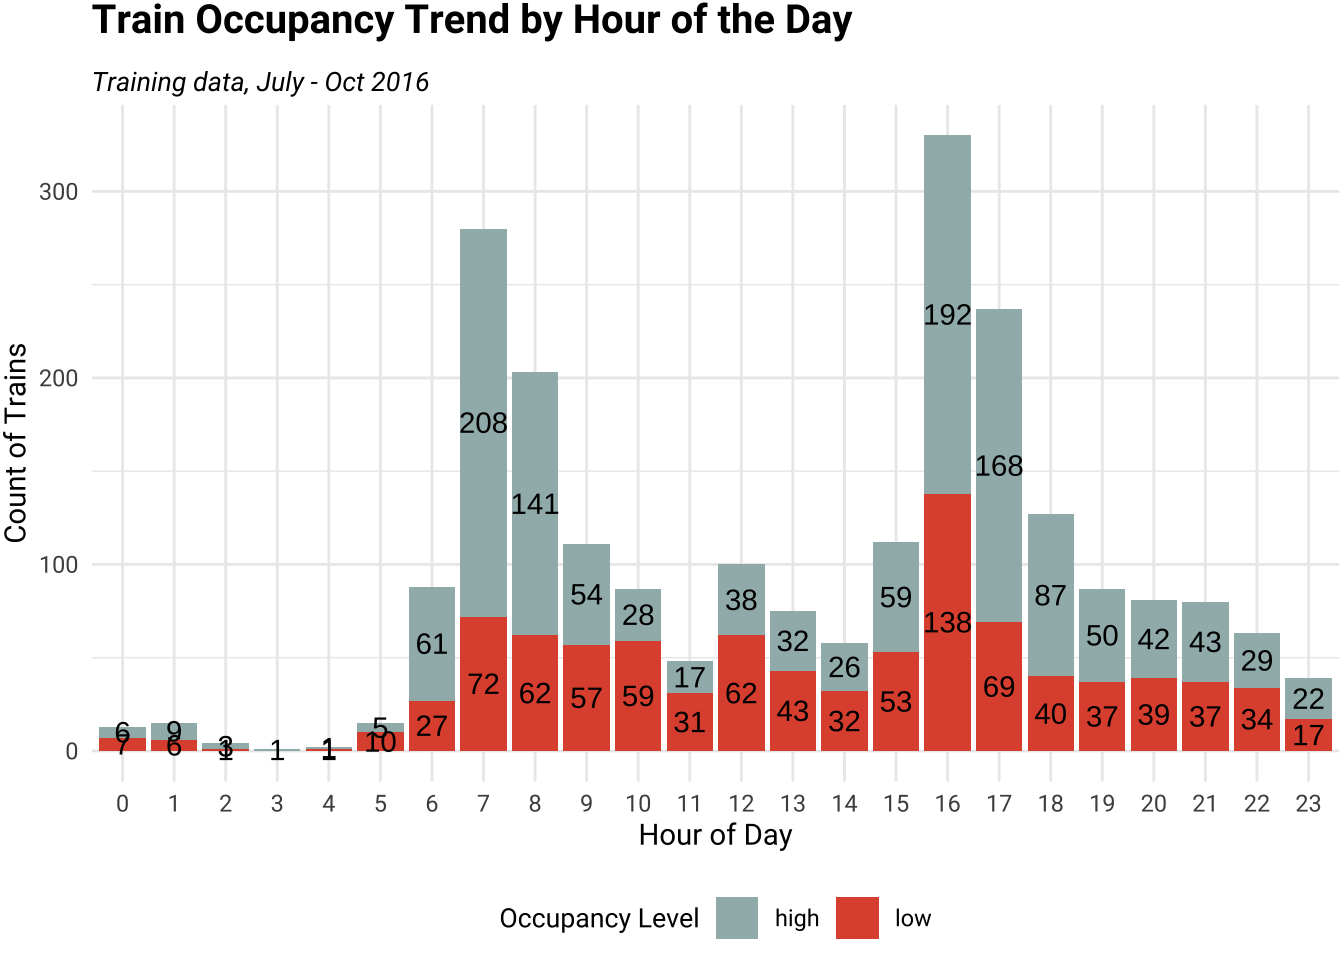
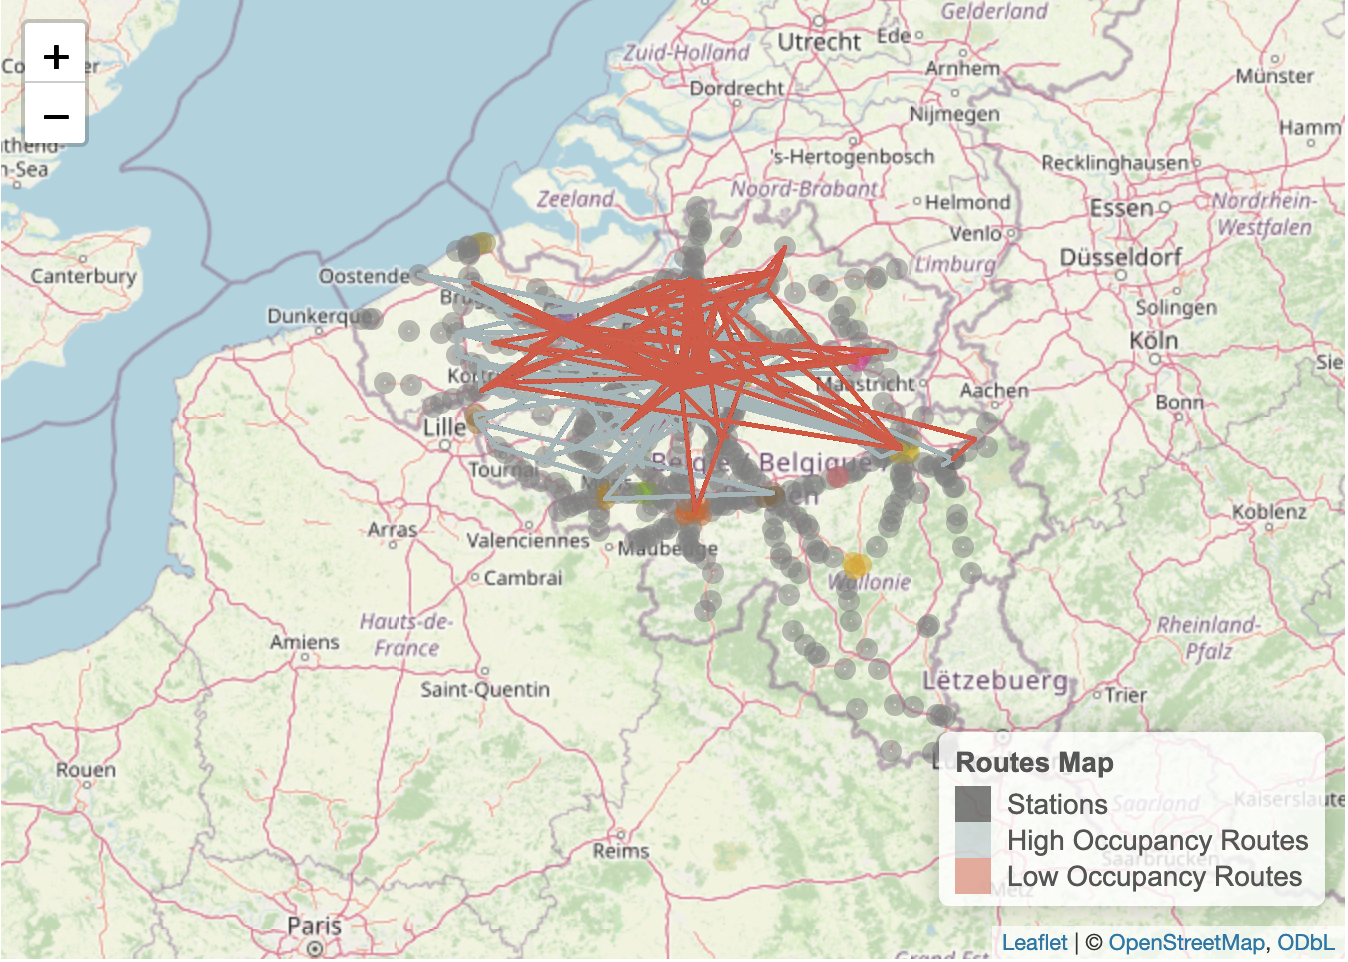
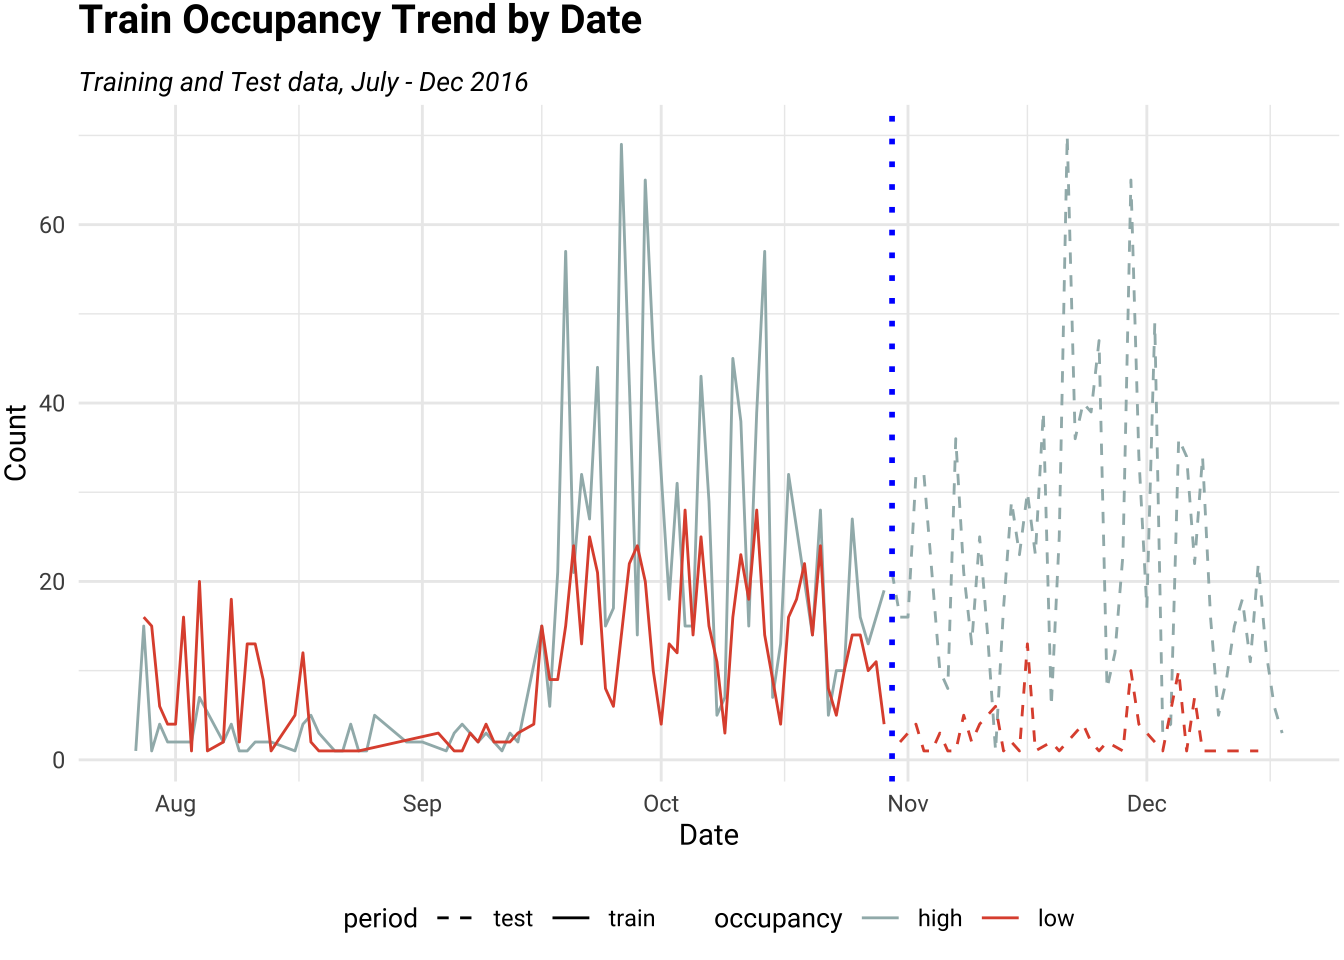
Nationale Maatschappij der Belgische Spoorwegen (NMBS), or Société nationale des chemins de fer belges (SNCB) is the National Railway Company of Belgium and the largest railway operator in the country. Let’s assume that the company needs to postpone its expansion due to a shortage of train personnel. Additionally, rising energy costs have increased operating expenses. Meanwhile, the company continues to face revenue losses due to low passenger numbers on some routes. Given these challenges, the company must develop a strategy to optimize resource allocation, improve operational efficiency, and increase revenue, particularly on low-occupancy routes. This project aims to provide transportation planners at NMBS with a model called Re-train, which is to predict train occupancy levels for different Origin-Destination (OD) pairs in the Belgian railway system by logistic regression.
Click here to see the technical memo and here to see the final presentation slide deck.
(Thesis) A Study on the Factors of Occurrence of Time Difference of Experience for a Transferred Policy: focusing on Address Policy in Republic of Korea
February, 2021
Thesis advisor: Prof. Choi, Taehyon (Graduate School of Public Administration, Seoul National University)
It has been 7 years since Korea’s full implementation of the Road Name Address. However, why do so many citizens still prefer land-lot addresses or the names of facilities such as buildings and apartments in situations where one needs to search for or describe a certain location? To find the answer to this question, this study reviews the introduction process of the address policy in Korea as an ‘incomplete policy transfer’, presented by Dolowitz and Marsh (2000), and describes the factors that cause the time difference of policy experience, a concept proposed by Kim (2015), in address policy. First, this study analyzed the results of Seoul Metropolitan Government’s survey on the public opinion on Road Name Address conducted between 2017 and 2019. Study on the results confirmed that there was an time difference of policy experience in the location and identification function of the Road Name Address. Next, through process tracing methods such as literature research, interviews, and spatial analysis, the creation of the address usage environment has been analyzed over time in two parts: an offline environment such as road name signs for pedestrians and drivers, and an online environment such as mobile maps and navigation. Results show that, the construction of the offline address usage environment was being delayed due to the differences in perception between central and local governments. And online address usage environment was being incompletely implemented due to differences in perception between the government and private sectors. Finally, this study suggests that in order to shorten the time difference of policy experience in address policy, the location and identification function of address should be clearly defined, and in particular, cooperation with the private sectors that implements the online address usage environment is important.
Both my full thesis in Korean and the summary in English are available.
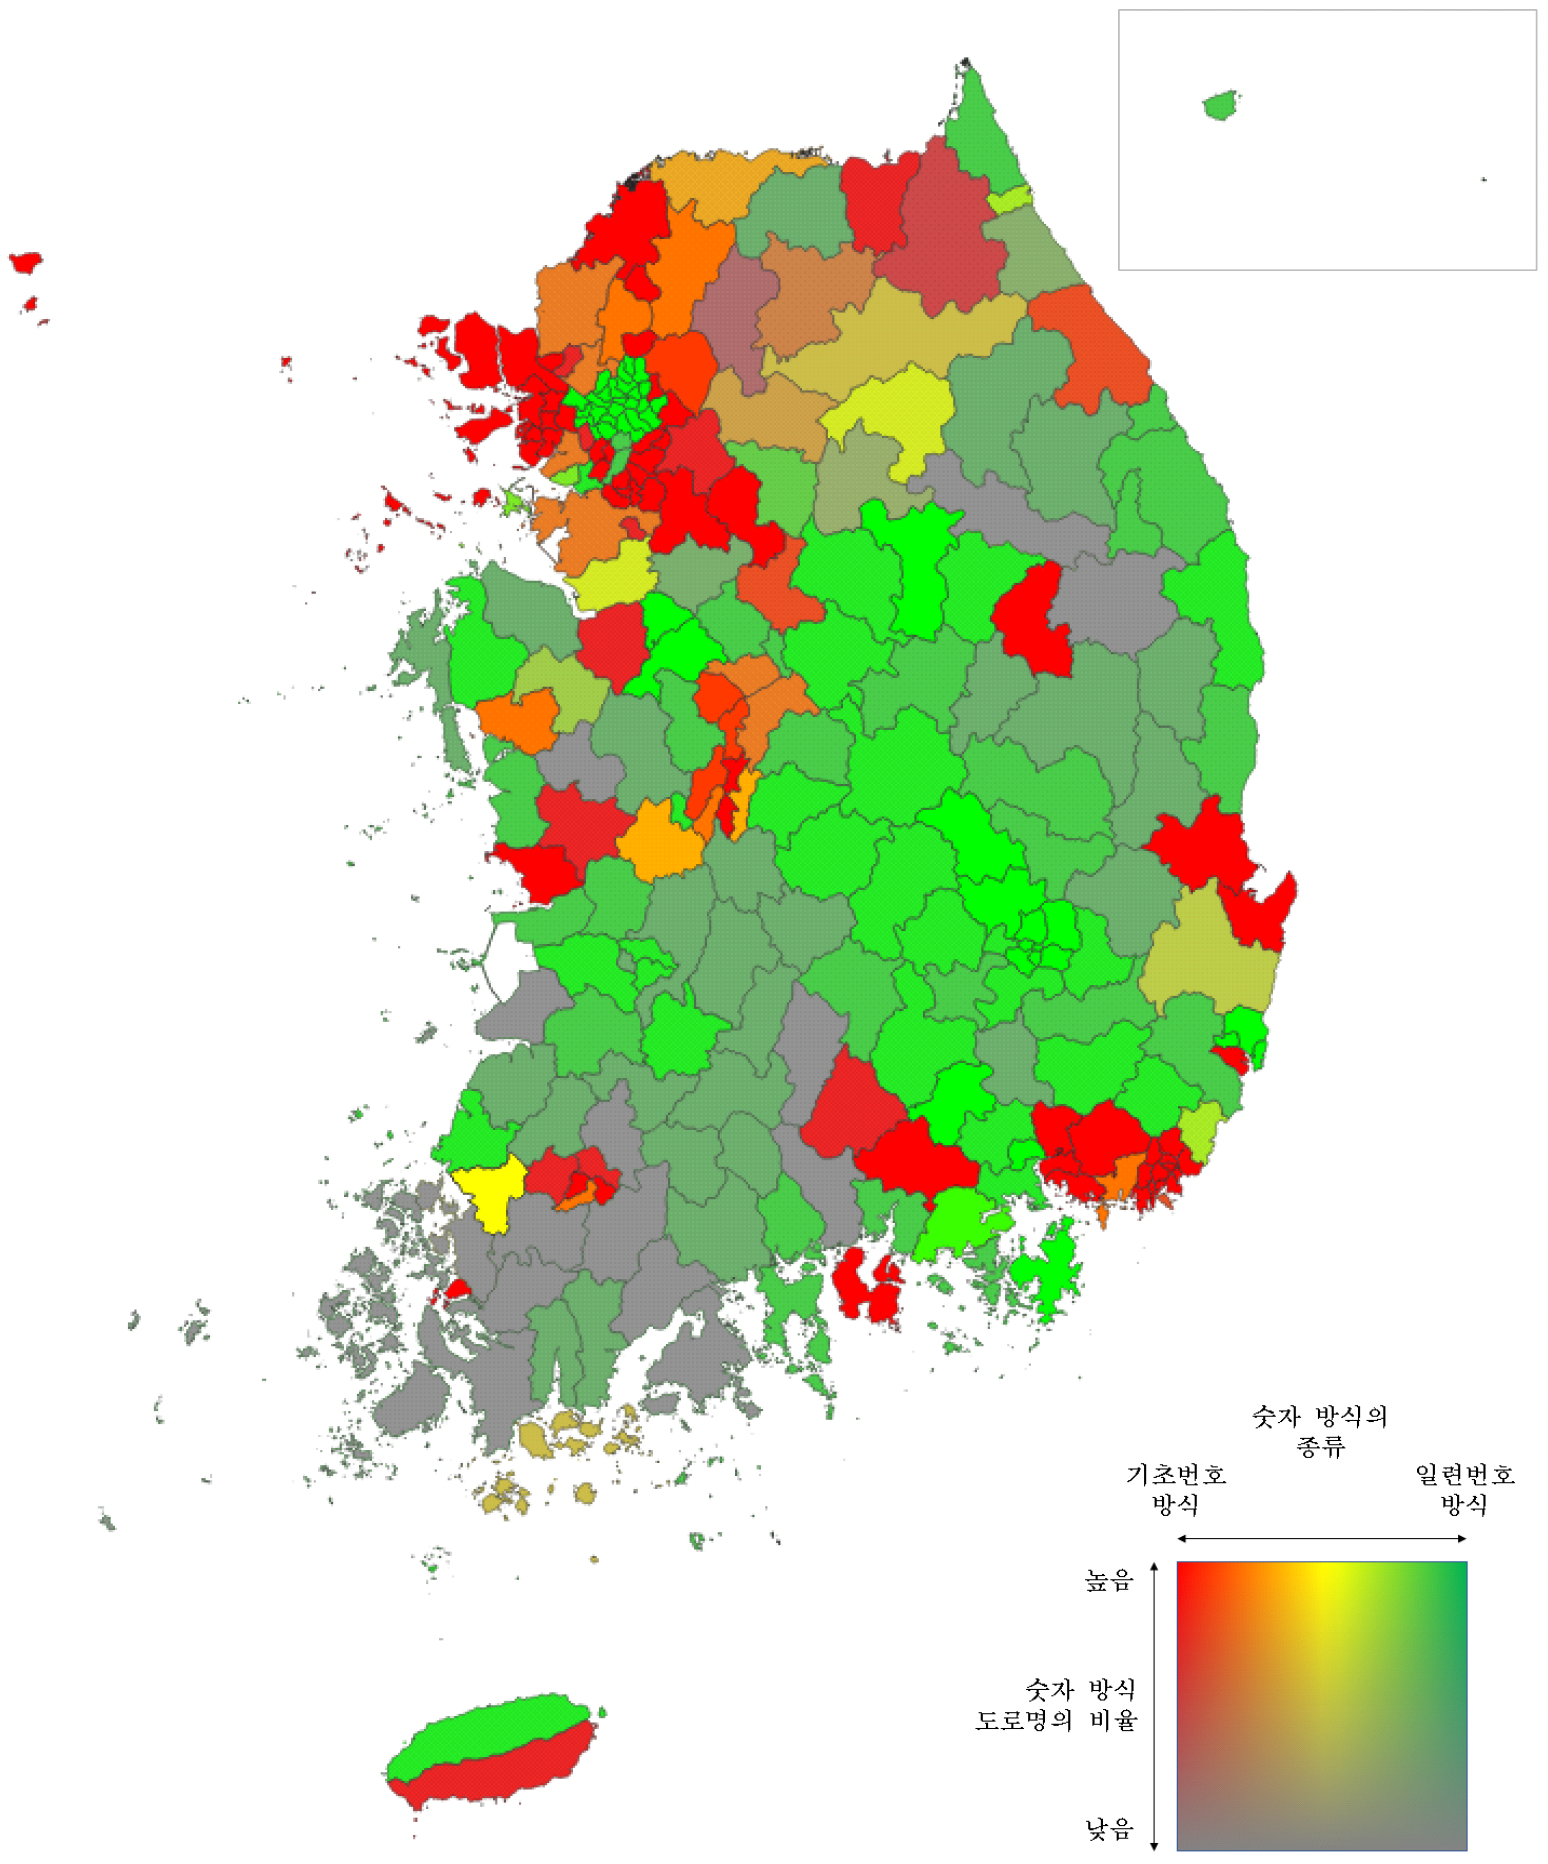
Figure. Thematic map of nationwide road name statistics by cities, counties, and districts (local authorities). Reds represent the acceptance of the base number naming method, while greens indicate the acceptance of the serial number naming method. Local authorities with high chroma represent a low proportion of proper noun naming and a high proportion of number naming. Data Source: Road name database as of April 30, 2020 from ROK MOIS (2021).
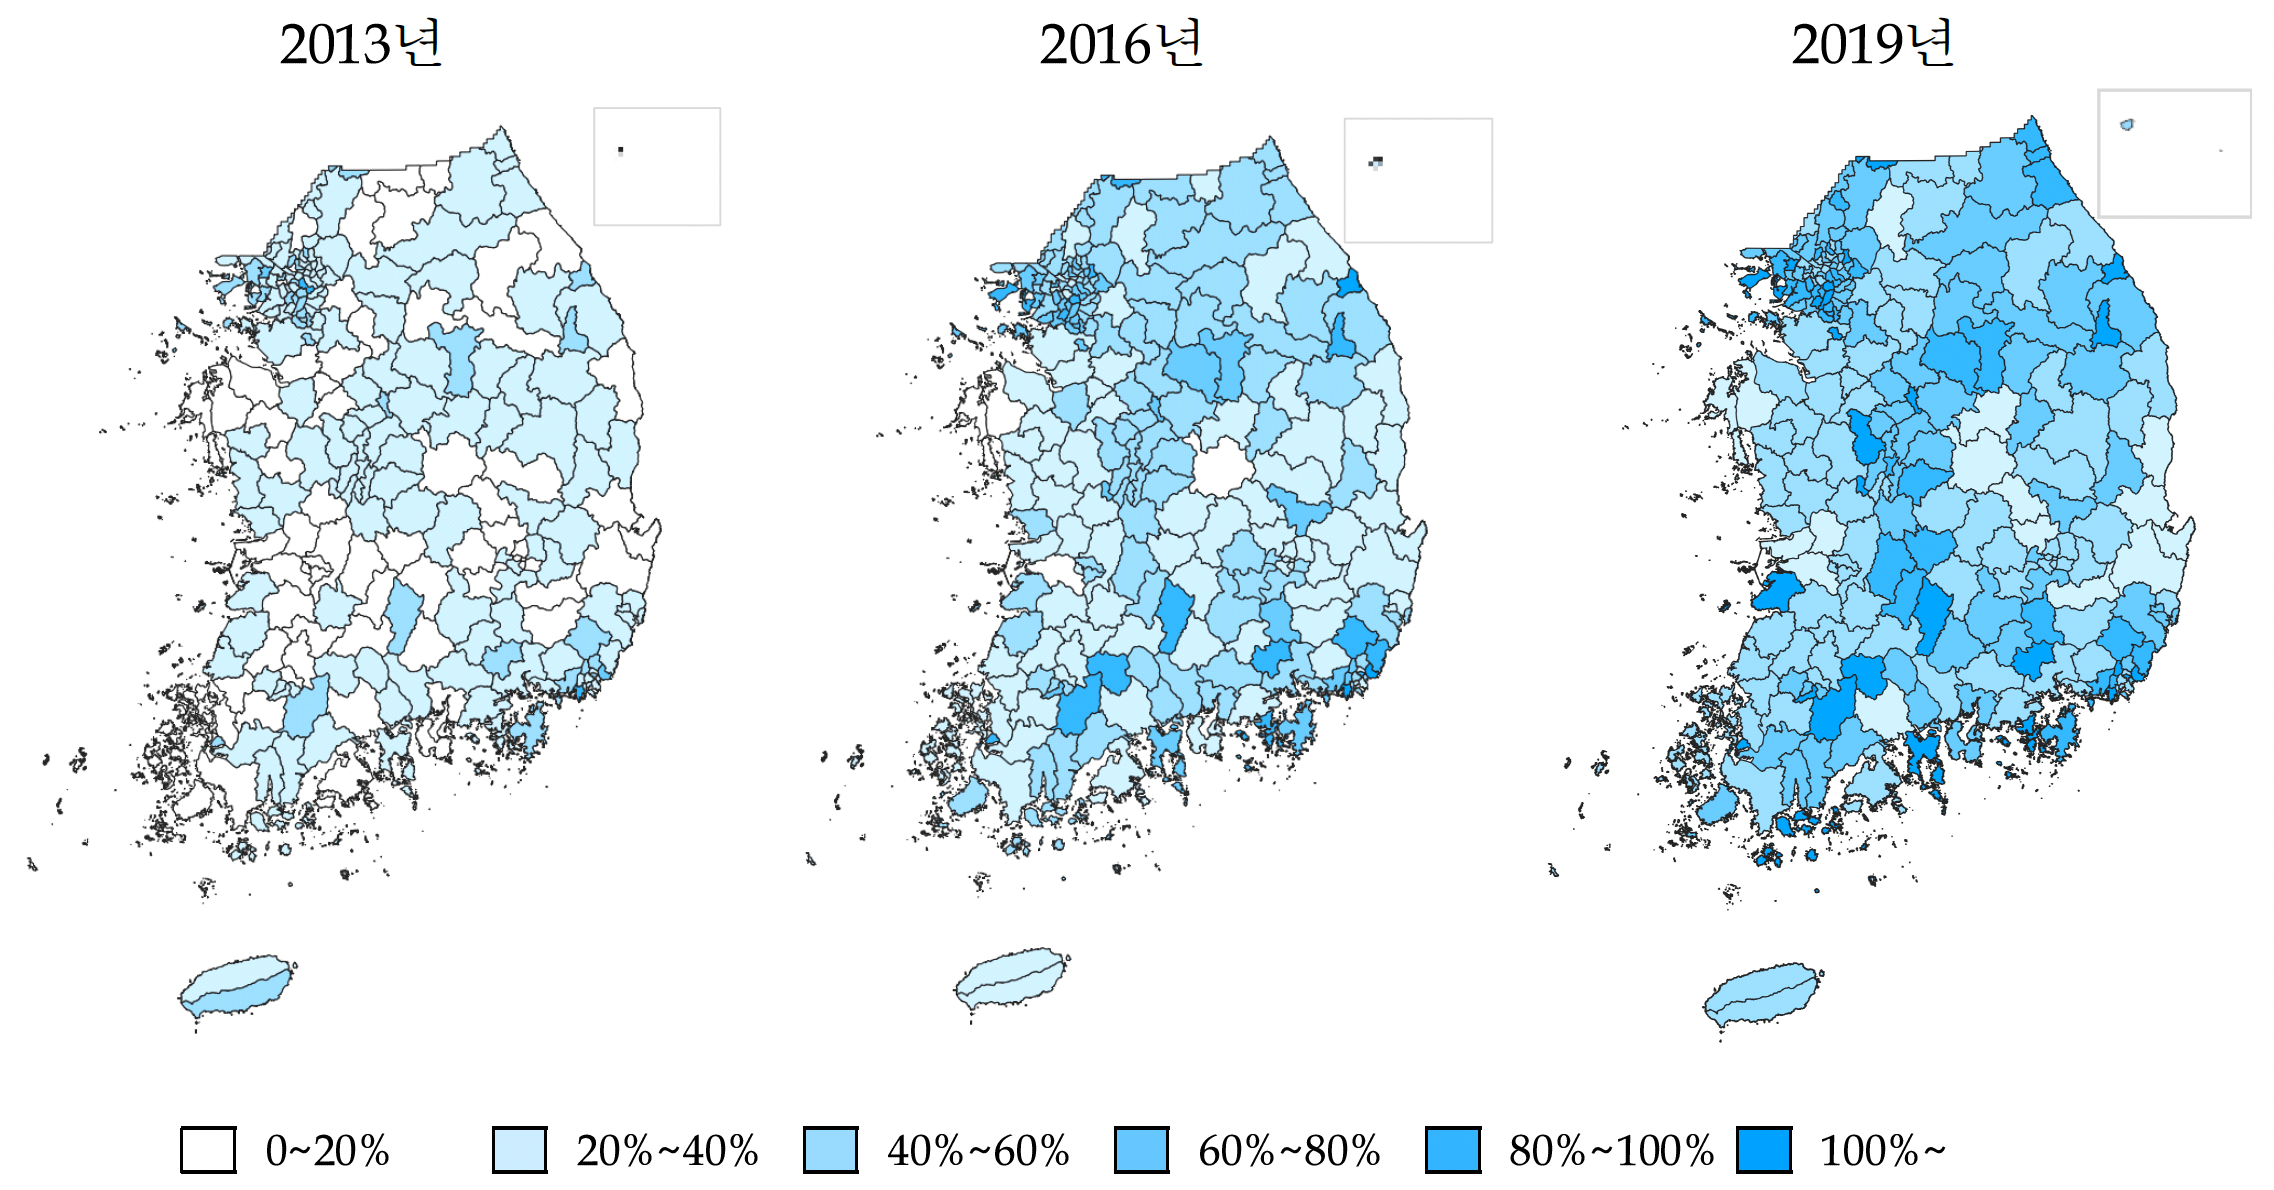
Figure. Thematic map of the ratio of the number of road name plates installed to the minimum required number of road name plates by city, county, and district by year of 2013, 2016, and 2019. Data Source: Database for Road Name Address Facilities provided by ROK MOIS (2021)
Page template forked from evanca