Youngsang's Portfolio

I am a civil servant for the Republic of Korea government, where I work for the Ministry of National Defense. I am also a Non-resident Fellow at the New Lines Institute for Strategy and Policy in Washington D.C. I hold a Master of Urban Spatial Analytics degree from the University of Pennsylvania. My research focuses on applying and integrating geospatial information in the defense sector. I am also interested in street address systems, geocoding, and wayfinding that utilize mobile maps.
Geospatial Information in Defense
The application of geospatial information is crucial not only in the intelligence field but also in the non-intelligence military domain. The first example demonstrates how remote sensing is utilized in military-related urban planning, employing machine learning through Python. Additionally, the following three examples show where geospatial information can be applied in the military sector, utilizing JavaScript with public data.
Classification of Military Installations in North Korea on OpenStreetMap using Satellite Imagery and Machine Learning
April 24, 2025
Instructor: Dr. Erus, Guray
Teaching assistant: Mr. Lebovits, Nissim
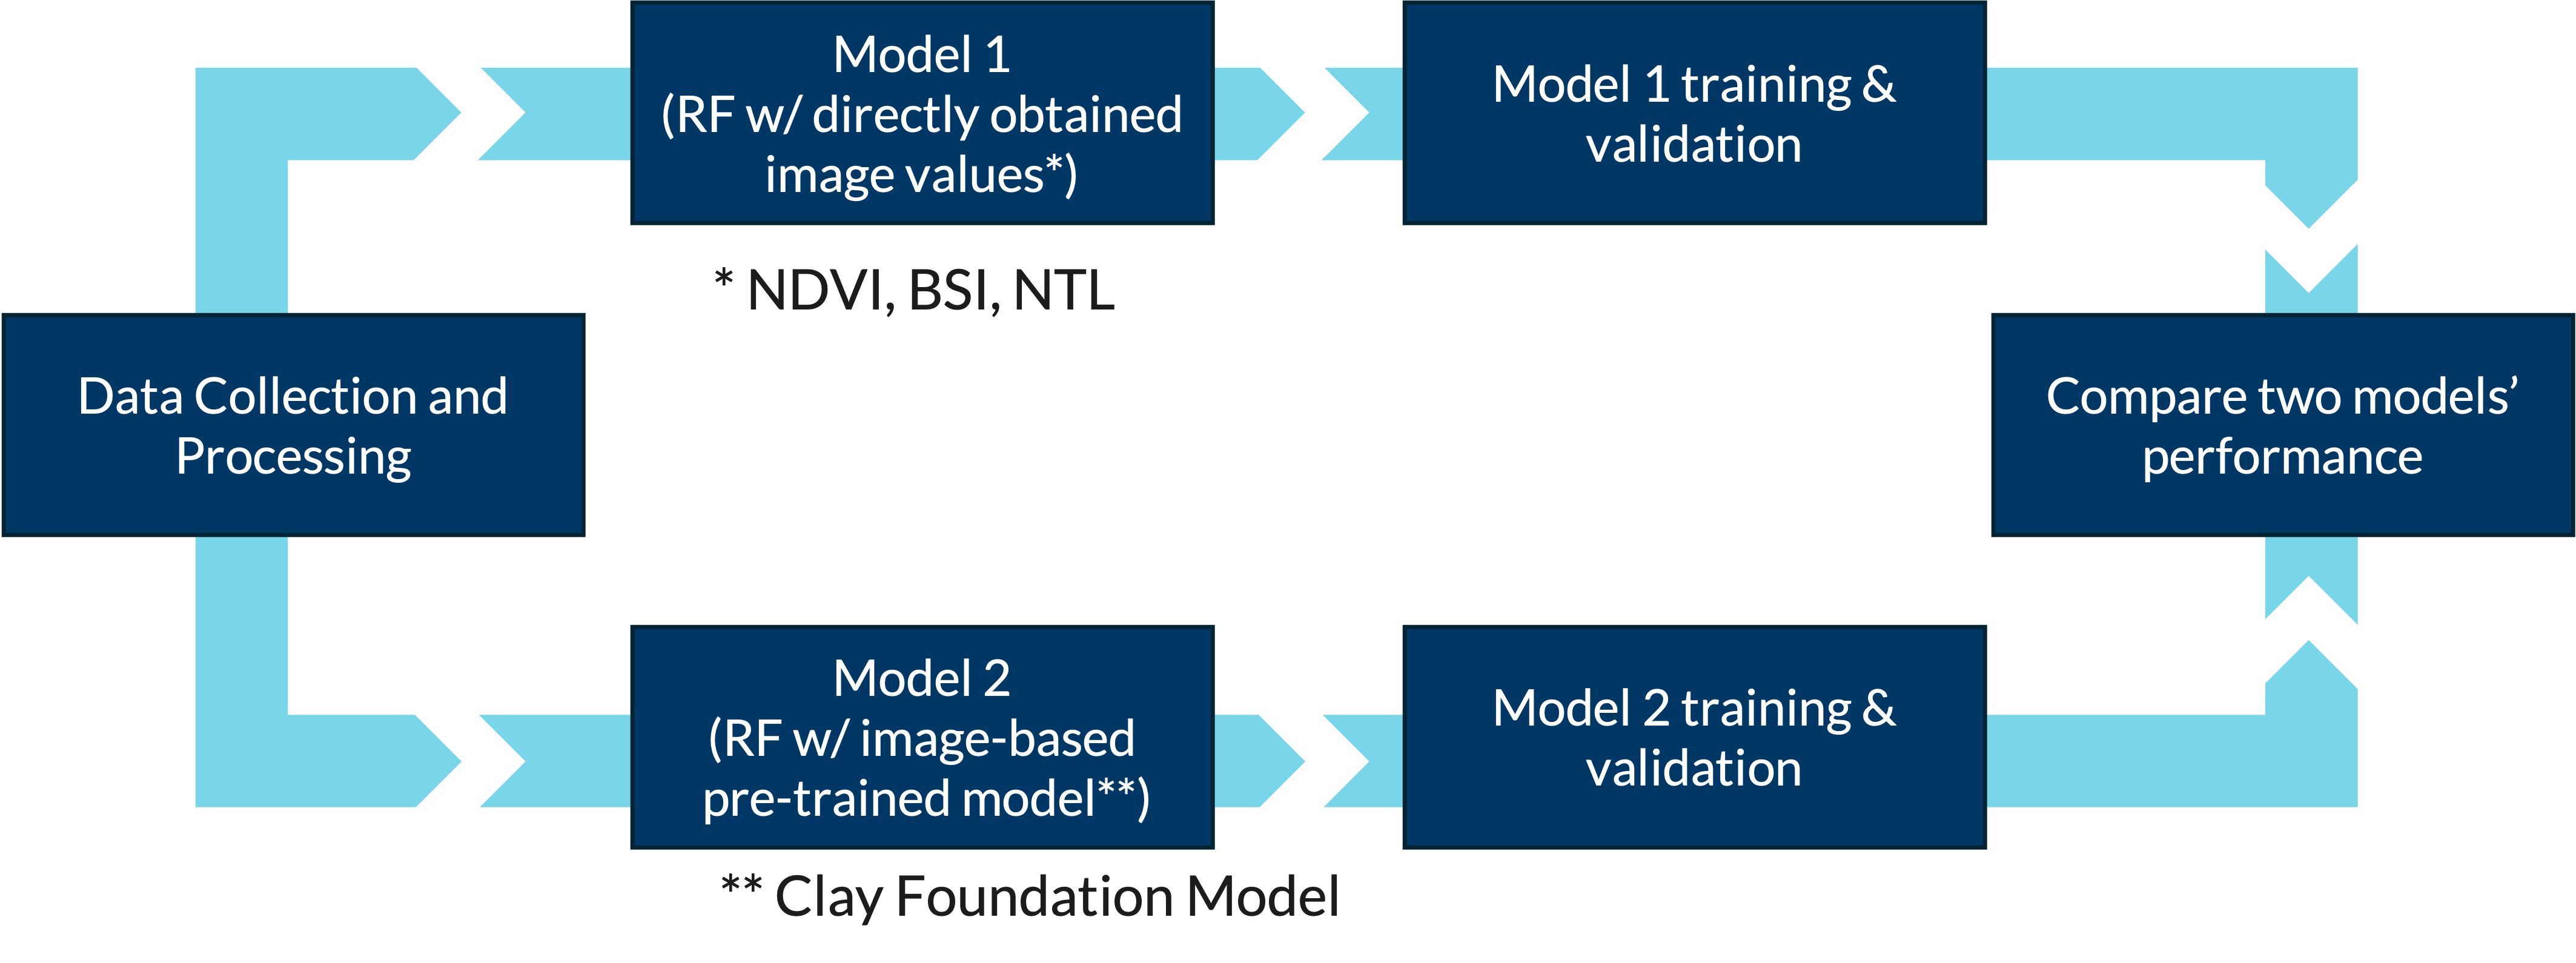
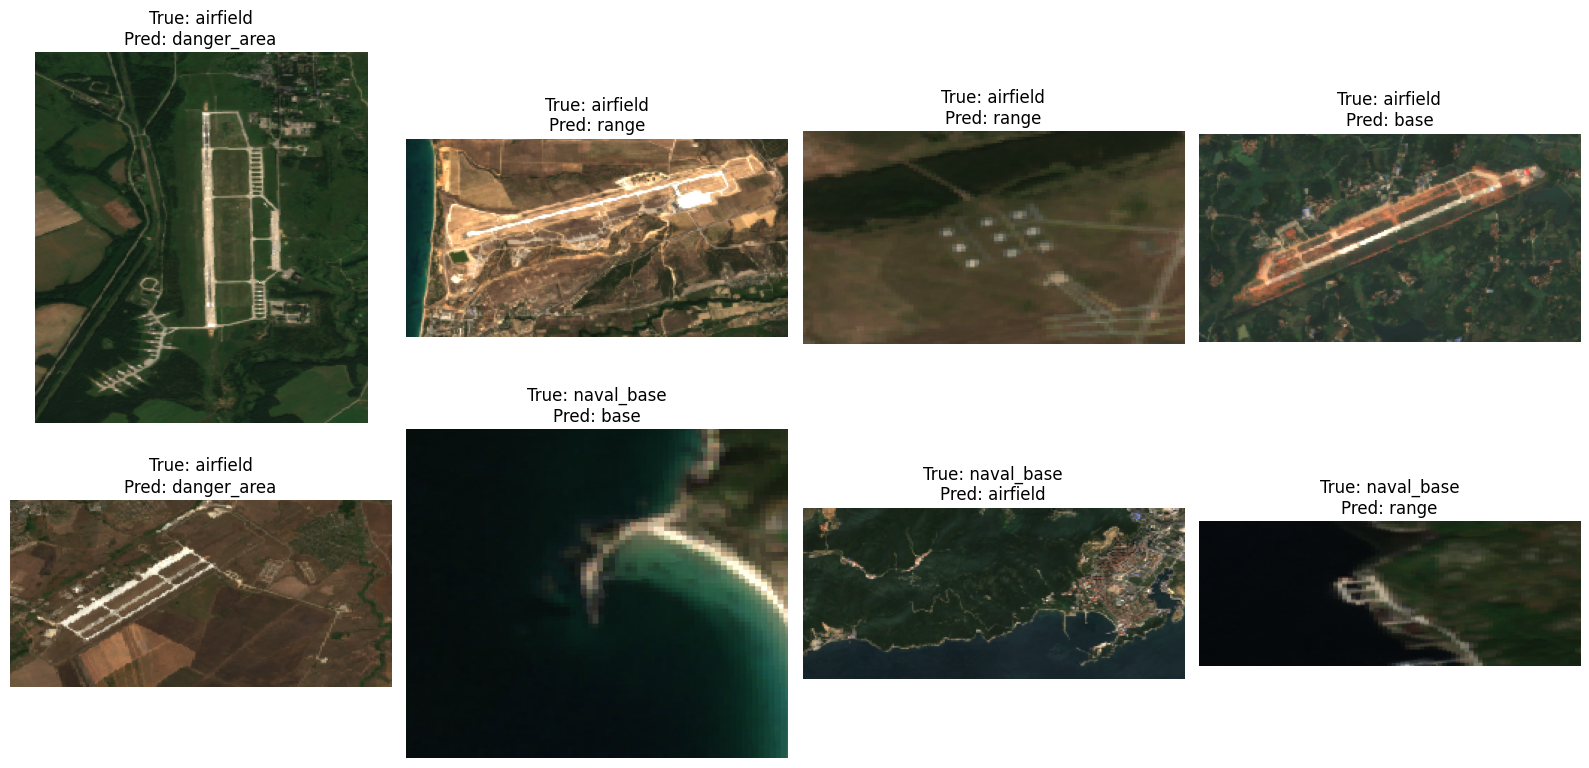
This assignment aims to create a complete classification of all military installations categories in North Korea (nK) based on Sentinel-2 Multispectral imagery, Visible Infrared Imaging Radiometer Suite (VIRRS) imagery, and OpenStreetMap (OSM) annotations. To achieve this, Random Forest (RF) algorithm was firstly applied using Python with 3 image values including NDVI, BSI, and NTL, along with longitude and latitude, the area of each polygon, and country from OSM polygons as independent variables. This approach achieved a classification accuracy of 67%. Second, Clay’s model, which is able to utilize more pre-computed EO embeddings, was applied alongside the first RF model, and but failed to sampling and patching.
Click here to see the final slide deck.
The Storymap of Major U.S. Military Facilities
September 25, 2024
Instructor: Mr. Poe, Mjumbe
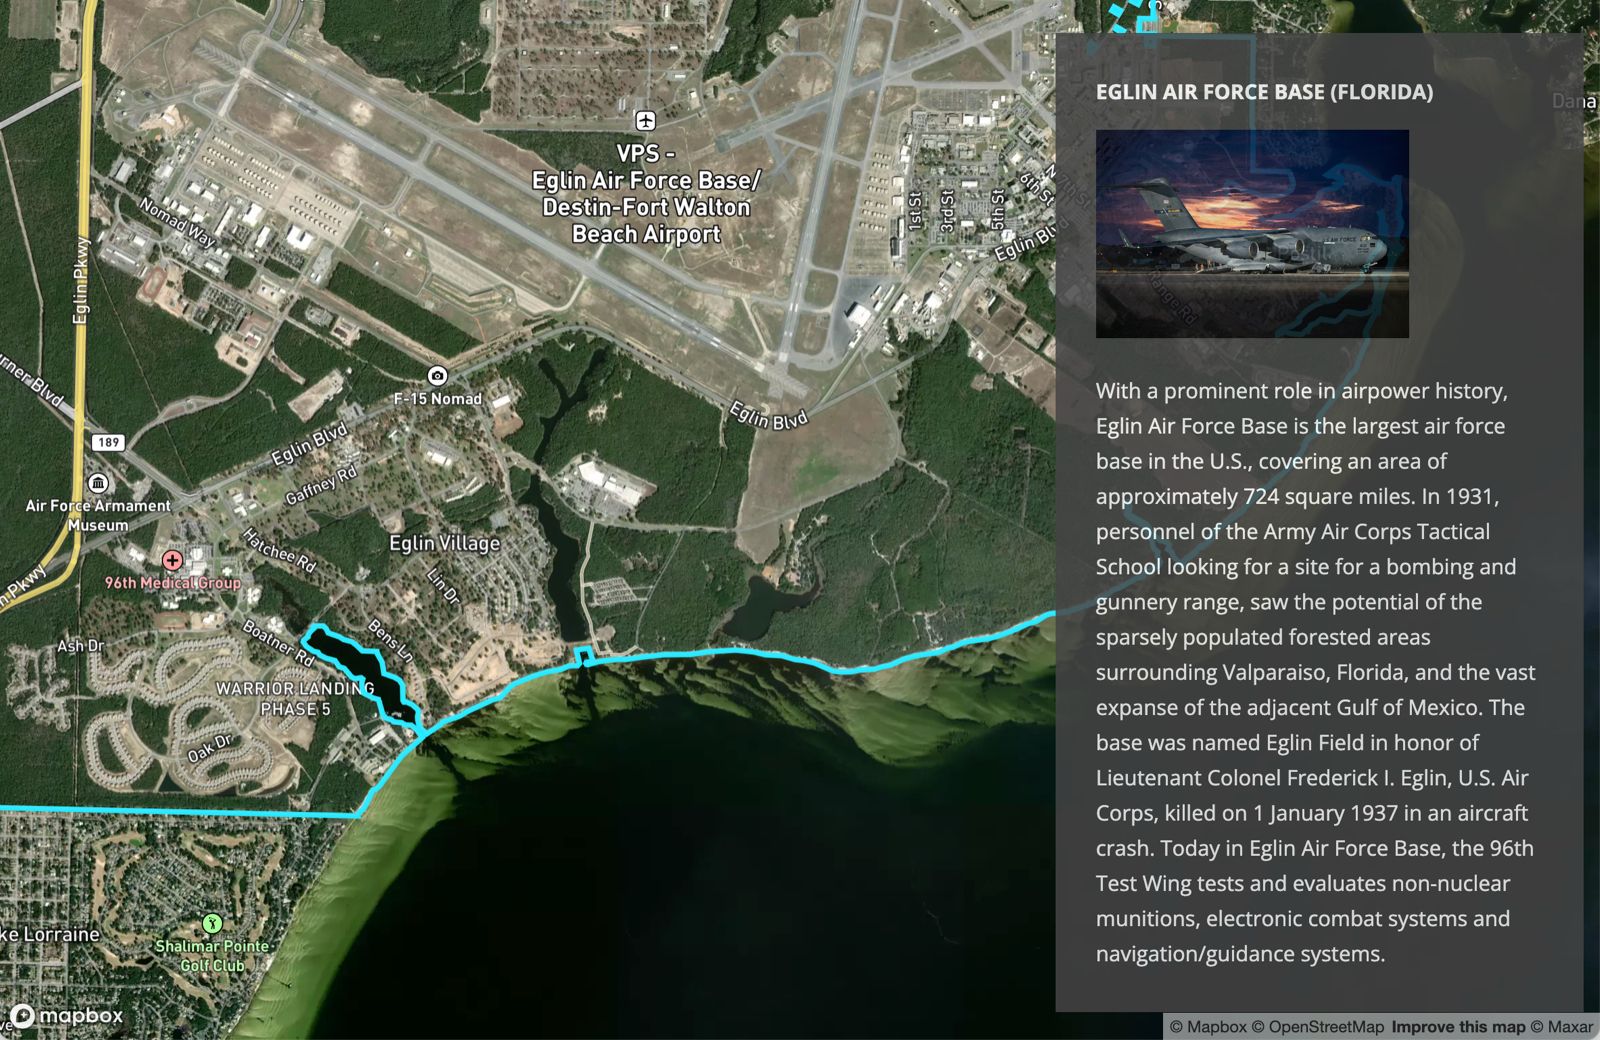
This storymap aims to provide a brief history of the U.S. military and an overview of major military bases for those who may work for/with U.S. Forces regarding U.S. military facilities in the future. The storymap introduces five major military facilities in the U.S.: West Point, Eglin Air Force Base, Naval Station Norfolk, Camp Pendleton, and Peterson Space Force Base.
Click here to see the live version of the storymap.
DefenseBoard
October 26, 2024
Instructor: Mr. Poe, Mjumbe
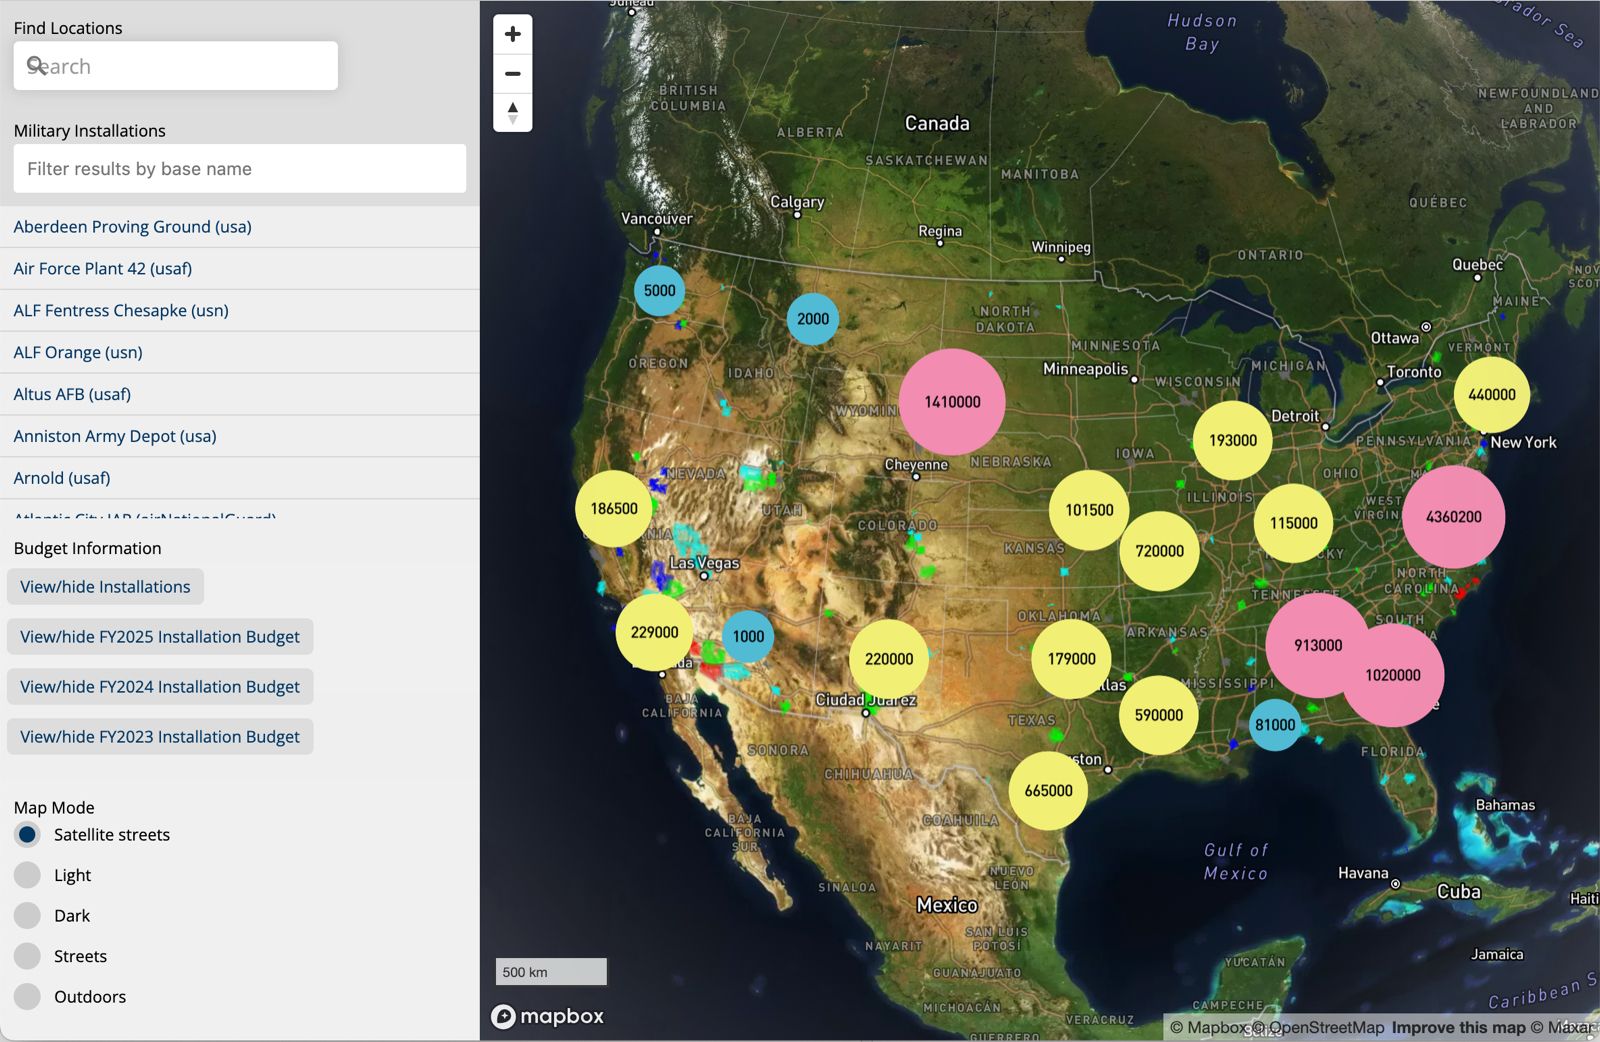
The DefenseBoard is a dashboard that uses spatial data to link various types of attributes in the defense sector such as military personnel, facilities, budget, logistics, etc. The map on the right displays publicly accessible base locations across the United States, while on the left, users can view attribute data by base, military unit, or region.
Click here to see the live version of the DefenseBoard.
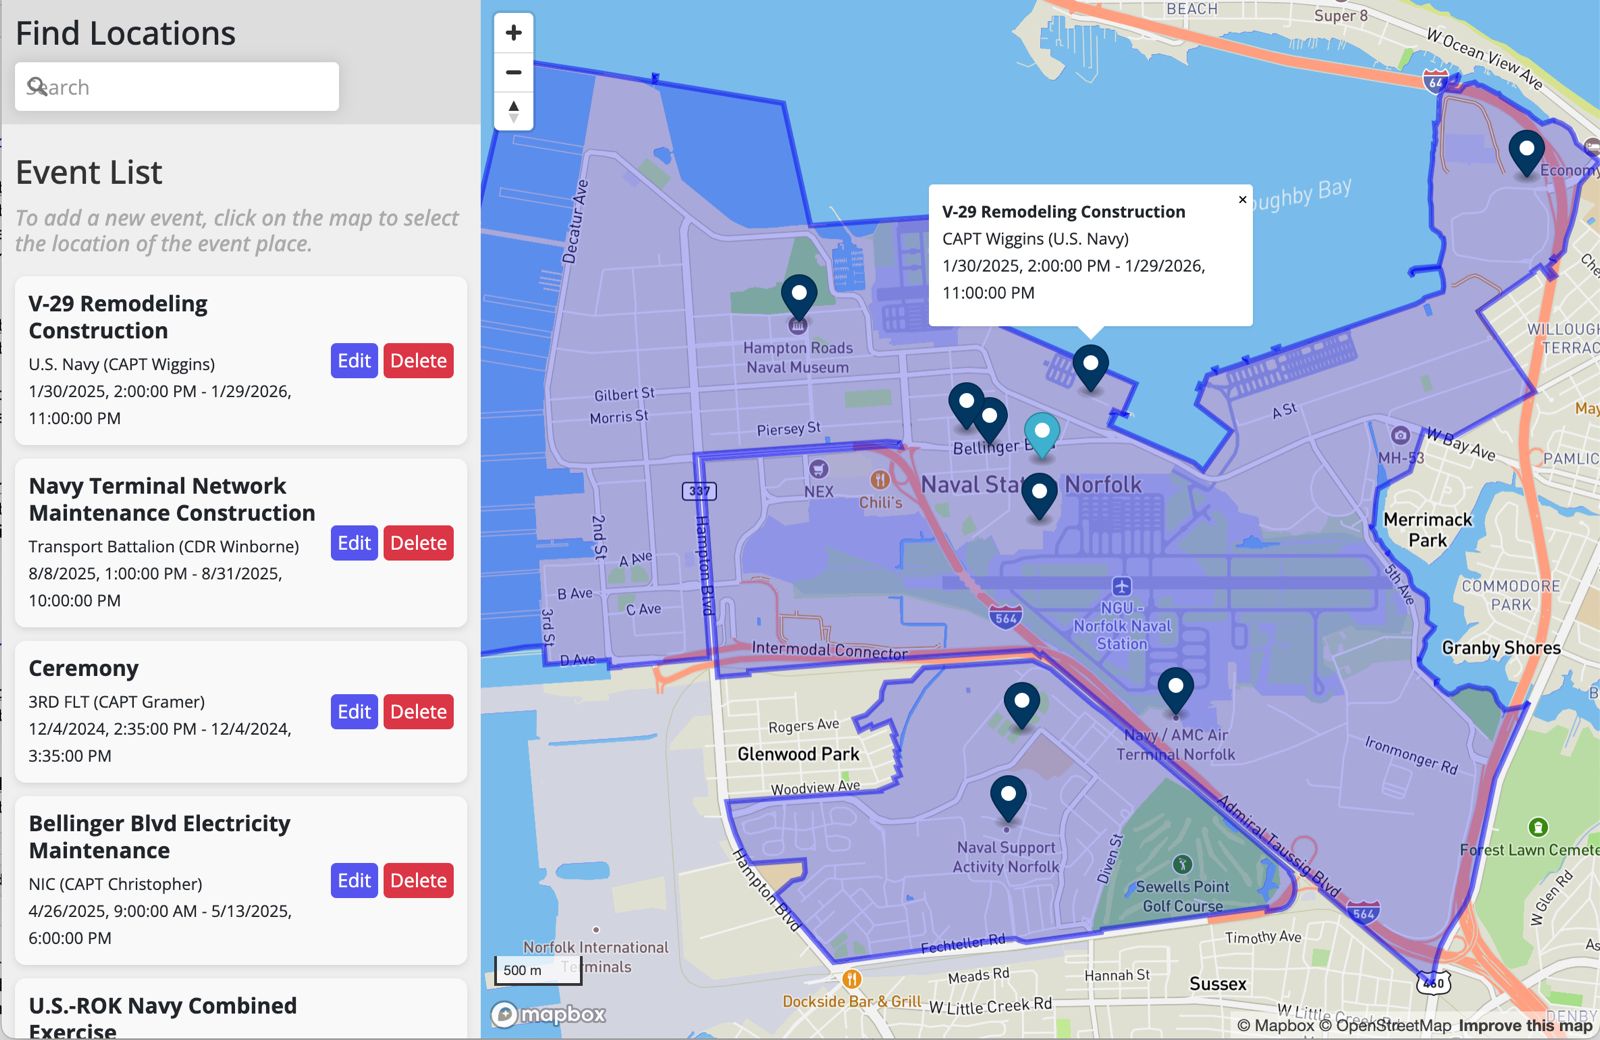
Base Management System
December 18, 2024
Instructor: Mr. Poe, Mjumbe
The Base Management System is a system for manage all kinds of events in a military base, such as training, exercise, sports, construction projects etc. This user-engagement project uses the Norfolk Naval Base in Virginia as an example. Therefore, the expected primary users of this system are the personnel stationed at the Norfolk Naval Base. The system will share schedules and locations of activities with relevant personnel within the base by utilizing Google Firebase.
Click here to see the live version of the Base Management System.
Page template forked from evanca